Rattanakosin International College of Creative Entrepreneurship, Rajamangala
University of Technology Rattanakosin, Nakhon Pathom 73170, Thailand.
Corresponding author email: jiang.song@rmutr.ac.th
Article Publishing History
Received: 15/10/2025
Accepted After Revision: 27/12/2025
China’s plant-based protein beverage manufacturers are facing intensifying competition and workforce-retention pressure, making employee loyalty a strategic concern for operational continuity and quality assurance. This study examines how multidimensional corporate culture influences employee loyalty in Chengde Lulu Co., Ltd. Using a quantitative survey, questionnaires were randomly distributed to eligible full-time employees (≥6 months tenure); 400 valid responses were retained after quality screening. Measures used 5-point Likert scales capturing six culture dimensions (corporate values, leadership, team spirit, interpersonal relationships, employee development, and social responsibility) and employee loyalty.
Data analysis included descriptive statistics, reliability (Cronbach’s alpha), KMO/Bartlett tests and exploratory factor analysis, correlation analysis, multiple regression, and one-way ANOVA for demographic differences. Results show that all six culture dimensions positively predict employee loyalty, with strong explanatory power (R² = 0.657); team spirit is the strongest predictor, while leadership remains significant but comparatively weaker. ANOVA indicates no significant loyalty differences across demographics (e.g., gender, age, salary). Practically, manufacturers should prioritize building cooperative team climates, clarifying shared values, strengthening development pathways, and embedding social responsibility to sustain loyalty beyond purely transactional incentives.
Corporate Culture, Employees’ Loyalty, Organization Behavior, Leadership
Chen X, Jiang S. Corporate Culture Affecting Employees’s Loyalty of Plant-Based Protein Beverage. SSN Journal of Management & Technology Research Journal. 2025;2(2).
Chen X, Jiang S. Corporate Culture Affecting Employees’s Loyalty of Plant-Based Protein Beverage. SSN Journal of Management & Technology Research Journal. 2025;2(2&3). Available from: <a href=”https://shorturl.at/zWjTz“>https://shorturl.at/zWjTz</a>
INTRODUCTION
In recent years, China’ s beverage industry has undergone rapid structural transformation driven by consumption upgrading, heightened health awareness, and intensified market competition [1]. According to industry analyses, the growth momentum of traditional sugary beverages has slowed, while plant-based and functional beverages have expanded steadily, reflecting consumers’ increasing emphasis on nutrition, sustainability, and lifestyle quality [2]. As product homogeneity increases and competition shifts from price-based rivalry to brand differentiation and organizational capability, internal management effectiveness, particularly workforce stability, has become a critical factor influencing firms’ long-term competitiveness [3].
Within this evolving industry landscape, Chengde Lulu Co., Ltd. represents a leading enterprise in China’ s plant-based protein beverage segment, with almond-based beverages as its core product line. Benefiting from early market entry and strong brand recognition, Chengde Lulu has maintained a dominant position in its niche market and reported stable operating revenues in recent years. However, as the plant-based beverage sector attracts new entrants and substitutes proliferate, the company faces increasing pressure not only in market expansion but also in internal organizational governance. Public disclosures and industry observations suggest that traditional manufacturing beverage firms, including Chengde Lulu, are encountering challenges related to employee turnover, workforce aging, and declining organizational cohesion, issues that directly threaten operational continuity and strategic execution [4].
From a managerial perspective, employee loyalty is particularly vital in beverage manufacturing enterprises, where standardized production processes, quality control, and cross-departmental coordination depend heavily on experienced and committed employees. Prior studies indicate that low employee loyalty is associated with higher turnover intention, reduced organizational commitment, and weakened collective efficiency, especially in manufacturing contexts [5, 6]. While compensation and external labor market conditions contribute to these outcomes, recent research increasingly emphasizes internal organizational factors, most notably corporate culture, as key determinants of employees’ long-term attachment to their organizations [7].
Corporate culture, conceptualized as a system of shared values, leadership practices, and behavioral norms, has been shown to influence employees’ attitudes, affective commitment, and retention-related behaviors [8, 9]. Empirical evidence from recent studies suggests that cultural dimensions such as value congruence, leadership support, team cohesion, and developmental opportunities play a significant role in shaping employee loyalty beyond transactional incentives [10]. However, existing research exhibits two notable gaps. First, most empirical investigations focus on service industries or knowledge-intensive sectors, whereas traditional manufacturing industries, particularly food and beverage manufacturing, remain underexplored. Second, prior studies often adopt partial or fragmented cultural frameworks, limiting understanding of how multiple cultural dimensions jointly influence employee loyalty in organizational settings.
These gaps are especially salient in the context of China’ s plant-based beverage manufacturing industry, where firms must simultaneously manage market expansion and internal transformation. Despite Chengde Lulu’ s representative status, little empirical research has systematically examined how corporate culture affects employee loyalty within such enterprises. Addressing this gap is essential not only for practical governance but also for advancing theory.
Accordingly, this study investigates the impact of corporate culture on employee loyalty in a plant-based protein beverage manufacturing enterprise, using Chengde Lulu as an empirical case. By conceptualizing corporate culture as a multidimensional construct encompassing corporate values, leadership, team spirit, interpersonal relationships, employee development, and social responsibility, this research seeks to extend existing culture, loyalty theories into an underexamined industrial context. Theoretically, the study contributes to organizational behavior literature by enriching the contextual applicability of corporate culture theory and clarifying its explanatory power in manufacturing settings. In doing so, it offers a more nuanced understanding of how internal cultural mechanisms shape employee loyalty under conditions of industrial transformation. Hence, this research aims:
RO1: To explore the dimensions included in corporate culture.
RO2: To examine the impact of corporate culture on employee loyalty through empirical analysis and to examine whether employee loyalty differs significantly across demographic characteristics, including gender, age, and salary level.
RO3: To derive practical managerial implications based on the empirical findings, providing guidance for corporate culture construction and employee loyalty management.
Literature review
Theoretical basis: Corporate culture theory explains how shared values, norms, and behavioral expectations within an organization shape employees’ cognition, emotions, and work-related behaviors. Contemporary scholarship conceptualizes corporate culture as a multi-dimensional system embedded in organizational practices rather than a static symbolic construct [11]. In recent years, research has increasingly adapted corporate culture theory to examine how internal cultural environments influence employee-related outcomes under conditions of organizational transformation and competitive pressure [12, 13]. This shift reflects growing recognition that culture functions as an internal governance mechanism that coordinates behavior and stabilizes employee attitudes in dynamic business contexts.
Culture has been examined as a predictor of employee attitudes, such as organizational commitment, engagement, and psychological attachment, emphasizing the role of value congruence and leadership practices in shaping employees’ perceptions of the organization [14]. Culture as a driver of retention-related outcomes, demonstrating that supportive cultural climates and developmental orientations significantly reduce turnover intention and enhance loyalty-related behaviors [15]. Culture has been increasingly analyzed in manufacturing and transitional industries, where standardized processes and collective coordination heighten the importance of shared norms and stable value systems [16]. Within this theoretical framework, corporate culture is understood as an internal environment that continuously exposes employees to organizational values, leadership cues, and relational norms, thereby shaping their long-term attitudes toward the organization.
Employee loyalty theory seeks to explain the formation and maintenance of employees’ enduring attachment to an organization and their willingness to remain and contribute over time [17]. Recent theoretical developments conceptualize employee loyalty as a cognitive, affective, behavioral construct, encompassing employees’ beliefs about the organization, emotional attachment, and intention to stay [18]. This perspective moves beyond earlier views that equated loyalty solely with tenure or compliance, emphasizing instead employees’ voluntary and attitudinal commitment. Loyalty measurement, distinguishing loyalty from closely related constructs such as organizational commitment and job satisfaction, while demonstrating their theoretical interconnections [19]. Loyalty has been widely examined as an outcome of organizational context, with studies highlighting the roles of leadership support, fairness, and cultural alignment in fostering employees intention to remain with the organization [20]. In this study, employee loyalty theory suggests that employees’ loyalty is not an immediate reaction to isolated incentives, but a cumulative outcome shaped by prolonged organizational experiences.
Taken together, the integration of corporate culture theory and employee loyalty theory offers a coherent explanatory framework for this study. Corporate culture theory explains how internal cultural environments shape employees’ perceptions and emotional attachment, while employee loyalty theory clarifies how these internalized perceptions translate into sustained loyalty. This combined theoretical perspective supports the examination of how multidimensional corporate culture influences employee loyalty in the context of a traditional plant-based protein beverage manufacturing enterprise.
Conceptual review: Corporate culture originates from Corporate Culture Theory, which conceptualizes culture as a system of shared values, norms, and practices that guide organizational members’ perceptions and behaviors [11]. Corporate culture is commonly defined as a multidimensional construct reflecting how values are articulated, leadership is enacted, and relationships are structured within the organization [21]. In the present study, corporate culture is defined as employees’ shared perceptions of the organizational environment formed through sustained exposure to corporate values, leadership behaviors, and relational norms within Chengde Lulu. Corporate culture is conceptualized as a multidimensional construct comprising six dimensions: corporate values, leadership, team spirit, interpersonal relationships, employee development, and social responsibility [22].
Employee loyalty is theoretically grounded in Employee Loyalty Theory, which explains employees’ enduring attachment to an organization and their willingness to remain and contribute over time [17]. Recent literature conceptualizes employee loyalty as a stable attitudinal, behavioral orientation that goes beyond short-term job satisfaction or contractual obligation [23]. It reflects employees’ psychological identification with the organization as well as their intention to maintain long-term employment relationships. Employee loyalty is often distinguished from organizational commitment while remaining closely related to it.
Loyalty emphasizes intention to stay, emotional attachment, and discretionary effort, and has been widely used as a key outcome variable in studies examining organizational environments and human resource practices [24]. In this study, employee loyalty is defined as employees’ overall psychological attachment to Chengde Lulu and their willingness to continue working for the organization. Employee loyalty is treated as a global construct capturing both attitudinal attachment and behavioral intention to remain, rather than being subdivided into multiple subtypes. This conceptualization facilitates the examination of the direct effects of multiple corporate culture dimensions on employees’ loyalty within a manufacturing enterprise.
Hypothesis development: Corporate values, leadership, team spirit, interpersonal relationships, employee development, and social responsibility represent core cultural components through which organizations regulate behavior and foster employee attachment [25, 26]. Clearly articulated corporate values strengthen employees’ emotional attachment and loyalty by aligning individual beliefs with organizational goals [27]. Leadership research further shows that supportive and value-consistent leadership, widely regarded as a core manifestation of corporate culture, enhances employees’ trust and loyalty by translating abstract values into daily managerial practices [28].
In addition, team-oriented cultural climates characterized by cooperation and shared responsibility have been found to foster collective identity and social belonging, thereby increasing employees’ willingness to remain with the organization, particularly in manufacturing environments that rely on coordinated task execution [29, 30]. Similarly, high-quality interpersonal relationships embedded in organizational culture have been shown to reduce psychological strain and enhance loyalty-related attitudes by strengthening trust and mutual support among employees [31]. Recent studies also highlight employee development as a salient cultural signal of organizational investment, demonstrating that development-oriented cultures significantly increase employee loyalty by enhancing perceived organizational support and future career expectations [32, 33].
Moreover, corporate social responsibility has increasingly been incorporated into corporate culture frameworks, with evidence suggesting that socially responsible cultures enhance employees’ organizational pride and moral identification, which in turn strengthen loyalty and intention to stay [34, 35]. Accordingly, the following hypotheses are proposed:
Table 1. Hypothesis development statement
| H1 | Corporate values have a significant positive impact on employee loyalty. |
| H2 | Leadership has a significant positive impact on employee loyalty. |
| H3 | Team spirit has a significant positive impact on employee loyalty. |
| H4 | Interpersonal relationships have a significant positive impact on employee loyalty. |
| H5 | Employee development has a significant positive impact on employee loyalty. |
| H6 | Social responsibility has a significant positive impact on employee loyalty. |
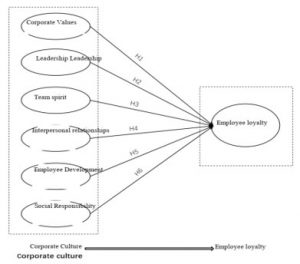
Theoretical framework: Figure 1 presents the theoretical framework of this study. Grounded in Corporate Culture Theory and Employee Loyalty Theory, the framework examines how corporate culture influences employee loyalty in a plant-based protein beverage manufacturing enterprise. Corporate Culture Theory explains how continuous exposure to organizational values, leadership practices, and relational norms shapes employees’ perceptions and evaluations of the organization, while Employee Loyalty Theory clarifies how these evaluations translate into employees’ stable attitudinal and behavioral orientation toward remaining with the organization.
The framework comprises two core constructs: corporate culture and employee loyalty. Corporate culture is conceptualized as a multidimensional construct consisting of six dimensions: corporate values, leadership, team spirit, interpersonal relationships, employee development, and social responsibility, while employee loyalty represents employees’ enduring psychological attachment and intention to stay. Based on prior literature, this study proposes that each dimension of corporate culture has a positive effect on employee loyalty (H1-H6).
METHODOLOGY
This study examines the impact of corporate culture on employee loyalty in the context of a plant-based protein beverage manufacturing enterprise, using Chengde Lulu Co., Ltd. as the empirical setting. A quantitative survey design was adopted to capture employees’ perceptions of corporate culture and their loyalty-related attitudes. This approach is appropriate for testing theoretically grounded relationships among latent constructs and has been widely applied in organizational and human resource management research [36].
The target population consists of full-time employees of Chengde Lulu across production, administrative, and managerial departments. To enhance the representativeness of the sample and reduce selection bias, simple random sampling was employed. Simple random sampling ensures that each member of the population has an equal probability of being selected, thereby improving the generalizability of statistical inferences [37]. A list of eligible employees was obtained with organizational approval, and questionnaires were distributed randomly among employees who had worked in the company for at least six months to ensure sufficient exposure to the organizational culture.
Data collection was conducted through a combination of on-site paper questionnaires and secure online survey links. Prior to analysis, returned questionnaires were screened to exclude incomplete responses, patterned answers, and those failing basic consistency checks. A total of 400valid responses were retained for subsequent analysis. This sample size meets the recommended requirements for structural equation modeling, which suggest a minimum ratio of 10 respondents per measurement item to ensure stable parameter estimation [38].
The questionnaire consisted of two sections. The first section collected demographic information, including gender, age, education level, and years of work experience. The second section measured the study variables using established scales adapted to the organizational context of Chengde Lulu. All items were assessed using a five-point Likert scale ranging from 1 (strongly disagree) to 5 (strongly agree). Corporate culture was operationalized as a multidimensional construct encompassing six dimensions: corporate values, leadership, team spirit, interpersonal relationships, employee development, and social responsibility. This operationalization is consistent with corporate culture theory, which emphasizes the joint influence of values, leadership, and relational practices on employee outcomes [39]. Employee loyalty was measured as employees’ overall psychological attachment to the organization and their intention to remain employed, reflecting both attitudinal and behavioral orientations [39].
This study employed a quantitative data analysis approach. Descriptive statistics were first used to summarize sample characteristics. Reliability analysis using Cronbach’ s alpha assessed the internal consistency of the measurement scales, followed by validity testing through KMO and Bartlett’ s tests and exploratory factor analysis. Correlation analysis examined associations among variables, while multiple regression analysis tested the effects of corporate culture dimensions on employee loyalty. In addition, one-way analysis of variance (ANOVA) was conducted to examine differences in employee loyalty across demographic groups.
RESEARCH RESULTS
Descriptive analysis: Descriptive statistical analysis is the process of summarizing and describing data in order to better understand its characteristics and distribution. Provide a foundation for further data analysis and interpretation. It helps to reveal the regularity, trends, and characteristics of data, providing a basis for data interpretation and comparison. Help researchers and decision-makers understand data more intuitively (Cox, 2006). Table 2 presents the demographic profile of the respondents, indicating that the sample is predominantly composed of male employees (71.5%), reflecting the gender structure commonly observed in traditional manufacturing enterprises.
The age distribution shows that the majority of respondents are middle-aged or older employees, with 41.3% aged between 36 and 45 and 46.0% aged 46 years and above, suggesting a relatively mature workforce. In terms of educational attainment, most respondents possess a high school or vocational school education (33.3%) or junior high school education and below (27.5%), followed by associate degrees (26.0%), while a smaller proportion hold undergraduate degrees (13.3%), indicating a workforce with predominantly practical and technical educational backgrounds. Consistent with this profile, respondents report substantial work experience, with 44.3% having 10–20 years of experience and 49.3% having over 20 years, highlighting a highly experienced employee group. Regarding job positions, the sample is largely concentrated in production (43.5%) and sales roles (43.0%), whereas technical, administrative, and financial positions account for relatively smaller proportions. Finally, the income distribution shows that most respondents earn between 2,000 and 4,000 yuan (57.3%) or 4,000 and 6,000 yuan (34.3%), reflecting the typical wage structure of employees in manufacturing-oriented beverage enterprises.
Table 2. Basic Information of Respondents
| Basic Information Of The Interviewee | Sample Size | Percentage | |
| Gender | male | 286 | 71.5 |
| female | 114 | 28.5 | |
|
Age |
20 years old and under | 0 | 0 |
| 21~25 | 0 | 0 | |
| 26~35 | 51 | 12.8 | |
| 36~45 | 165 | 41.3 | |
| 46 years old and above | 184 | 46 | |
|
Educational Attainment |
junior high school and below | 110 | 27.5 |
| High school or vocational school | 133 | 33.3 | |
| associate degree | 104 | 26 | |
| undergraduate | 53 | 13.3 | |
| postgraduate | 0 | 0 | |
|
Years Of Work Experience |
Within 2 years | 0 | 0 |
| 2-5 years | 6 | 1.5 | |
| 5-10 years | 19 | 4.8 | |
| 10-20 years | 177 | 44.3 | |
| Over 20 years | 198 | 49.3 | |
|
Job Position |
production personnel | 174 | 43.5 |
| technical personnel | 28 | 7 | |
| Administrative management personnel | 20 | 5 | |
| financial personnel | 6 | 1.5 | |
| salesperson | 172 | 43 | |
|
Salary Income |
Below 2000 yuan | 3 | 0.8 |
| 2000~4000 yuan | 229 | 57.3 | |
| 4000~6000 yuan | 137 | 34.3 | |
| 6000~8000 yuan | 25 | 6.3 | |
| Above 8000 yuan | 6 | 1.5 | |
Reliability Analysis:Table 3 reports the reliability results for each construct, indicating a high level of internal consistency across all measurement scales. The Cronbach’ s alpha coefficients for the six dimensions of corporate culture range from 0.874 to 0.938, while the coefficient for employee loyalty reaches 0.966, all of which exceed commonly accepted reliability thresholds. Methodological literature generally suggests that a Cronbach’ s alpha value above 0.70 indicates acceptable reliability, values above 0.80 reflect good reliability, and values exceeding 0.90 demonstrate excellent internal consistency suitable for rigorous empirical research [40, 41]. Accordingly, the alpha values for corporate values, team spirit, and interpersonal relationships indicate good reliability, whereas leadership, employee development, and social responsibility exhibit excellent reliability. The very high alpha coefficient for employee loyalty further confirms strong internal consistency, although such values may also suggest potential item redundancy, which can be further examined through item–total correlations and confirmatory factor analysis [42].
Table 3. Reliability test of each variable
| Variable | Quantity of measurement items | Cronbach’s alpha coefficient |
| Corporate Values | 4 | 0.889 |
| leadership | 4 | 0.938 |
| team spirit | 4 | 0.897 |
| interpersonal relationships | 4 | 0.874 |
| Employee Development | 4 | 0.924 |
| social responsibility | 4 | 0.930 |
| Employee loyalty | 8 | 0.966 |
Validity analysis: Table 4 presents the results of the Kaiser–Meyer–Olkin (KMO) measure and Bartlett’ s test of sphericity, which together assess the suitability of the data for factor analysis. The KMO value of 0.959 far exceeds the commonly recommended threshold of 0.60, indicating excellent sampling adequacy and suggesting that the correlations among variables are sufficiently compact to yield reliable and distinct factors [41, 43]. According to Kaiser’ s classification, KMO values above 0.90 are considered “marvelous,” reflecting a very strong common variance structure among the measurement items. In addition, Bartlett’ s test of sphericity is statistically significant (χ² = 12,599.132, df = 496, p < 0.001), rejecting the null hypothesis that the correlation matrix is an identity matrix. This result confirms that meaningful correlations exist among the variables and that factor analysis is appropriate. Collectively, these findings demonstrate that the dataset possesses excellent factorability and provides a robust empirical basis for subsequent exploratory and confirmatory factor analyses.
Table 4. KMO and Bartlett’s test
| KMO value. | 0.959 | |
| Bartlett sphericity test | Approximate chi square (x ²) | 12599.132 |
| Degrees of Freedom (df) | 496 | |
| Significance (p) | 0.000 | |
From Table 5, it can be seen that the data is divided into 7 common factors, with variance explanatory rates of 20.362%, 10.92%, 10.826%, 10.414%, 9.895%, 9.272%, and 8.773%, respectively. After rotation, the cumulative variance explanatory rate is 80.460%, which is greater than 50%. The 7 common factors extracted from this data can explain 80.46% of the total data variability. The specific distribution of these 7 dimensions is consistent with the dimensions of each item in this questionnaire. And in the same dimension, the factor loading coefficients of all measurement items are all greater than 0.6, indicating that the validity of the scale is relatively high, the measurement item settings are reasonable, and there is no need to make changes or deletions. The loading coefficients of the seven factors are relatively large, indicating that the questionnaire design is reasonably divided into six dimensions: corporate values, leadership, team spirit, interpersonal relationships, employee development, and social responsibility.
Table 5. Factor analysis results of each measurement item in the questionnaire
| Measurement Items | Factor loading coefficient | ||||||
| Factor 1 | Factor 2 | Factor 3 | Factor 4 | Factor 5 | Factor 6 | Factor 7 | |
| CV1 | 0.161 | 0.116 | 0.079 | 0.15 | 0.77 | 0.119 | 0.175 |
| CV2 | 0.297 | 0.179 | 0.139 | 0.149 | 0.754 | 0.209 | 0.13 |
| CV3 | 0.268 | 0.161 | 0.153 | 0.182 | 0.754 | 0.088 | 0.169 |
| CV4 | 0.287 | 0.26 | 0.176 | 0.205 | 0.717 | 0.131 | 0.186 |
| LS1 | 0.258 | 0.76 | 0.217 | 0.195 | 0.18 | 0.14 | 0.161 |
| LS2 | 0.299 | 0.771 | 0.173 | 0.203 | 0.175 | 0.132 | 0.143 |
| LS3 | 0.22 | 0.784 | 0.158 | 0.233 | 0.196 | 0.174 | 0.189 |
| LS4 | 0.261 | 0.793 | 0.161 | 0.241 | 0.194 | 0.23 | 0.145 |
| TS1 | 0.235 | 0.241 | 0.19 | 0.155 | 0.132 | 0.738 | 0.191 |
| TS2 | 0.338 | 0.161 | 0.253 | 0.194 | 0.16 | 0.701 | 0.233 |
| TS3 | 0.421 | 0.188 | 0.223 | 0.224 | 0.097 | 0.651 | 0.22 |
| TS4 | 0.198 | 0.118 | 0.12 | 0.107 | 0.18 | 0.772 | 0.151 |
| IN1 | 0.395 | 0.131 | 0.181 | 0.241 | 0.229 | 0.062 | 0.682 |
| IN2 | 0.08 | 0.195 | 0.119 | 0.077 | 0.198 | 0.265 | 0.749 |
| IN3 | 0.195 | 0.306 | 0.218 | 0.141 | 0.159 | 0.224 | 0.7 |
| IN4 | 0.431 | 0.04 | 0.098 | 0.145 | 0.174 | 0.193 | 0.708 |
| ED1 | 0.193 | 0.132 | 0.818 | 0.191 | 0.099 | 0.216 | 0.094 |
| ED2 | 0.188 | 0.221 | 0.808 | 0.149 | 0.145 | 0.177 | 0.135 |
| ED3 | 0.329 | 0.201 | 0.743 | 0.181 | 0.133 | 0.129 | 0.154 |
| ED4 | 0.331 | 0.109 | 0.796 | 0.173 | 0.162 | 0.126 | 0.165 |
| SR1 | 0.283 | 0.182 | 0.201 | 0.742 | 0.232 | 0.096 | 0.234 |
| SR2 | 0.271 | 0.199 | 0.188 | 0.727 | 0.203 | 0.235 | 0.14 |
| SR3 | 0.279 | 0.263 | 0.181 | 0.803 | 0.153 | 0.152 | 0.108 |
| SR4 | 0.243 | 0.246 | 0.202 | 0.788 | 0.185 | 0.158 | 0.097 |
| EL1 | 0.670 | 0.271 | 0.191 | 0.252 | 0.18 | 0.273 | 0.114 |
| EL2 | 0.761 | 0.201 | 0.209 | 0.173 | 0.179 | 0.221 | 0.207 |
| EL3 | 0.753 | 0.209 | 0.224 | 0.216 | 0.203 | 0.228 | 0.122 |
| EL4 | 0.781 | 0.194 | 0.18 | 0.172 | 0.254 | 0.183 | 0.109 |
| EL5 | 0.768 | 0.186 | 0.188 | 0.207 | 0.185 | 0.15 | 0.194 |
| EL6 | 0.802 | 0.151 | 0.204 | 0.24 | 0.209 | 0.13 | 0.222 |
| EL7 | 0.783 | 0.184 | 0.222 | 0.191 | 0.164 | 0.205 | 0.209 |
| EL8 | 0.757 | 0.219 | 0.204 | 0.142 | 0.223 | 0.185 | 0.163 |
| variance explained ratio | 20.362% | 10.92% | 10.826% | 10.414% | 9.895% | 9.272% | 8.773% |
| Cumulative variance explanation rate | 20.362% | 31.282% | 42.107% | 52.521% | 62.416 | 71.688% | 80.460% |
Correlation Analysis:Table 6 presents the Pearson correlation coefficients among the study variables, revealing statistically significant positive relationships between all constructs at the 0.01 level (two-tailed). The correlations among the six corporate culture dimensions—corporate values (CV), leadership (LS), team spirit (TS), interpersonal relationships (IN), employee development (ED), and social responsibility (SR)—range from 0.482 to 0.632, indicating moderate associations. According to methodological guidelines, correlation coefficients below 0.80 suggest that the constructs are related yet empirically distinct, thereby alleviating concerns regarding multicollinearity [41].
Importantly, employee loyalty (EL) demonstrates moderately strong positive correlations with all six corporate culture dimensions, with coefficients ranging from 0.624 to 0.679, implying that more favorable perceptions of corporate culture are associated with higher levels of employee loyalty. These values exceed the threshold of 0.30, which is commonly interpreted as indicating a meaningful relationship in behavioral research, while remaining below levels that would indicate redundancy between constructs. Overall, the correlation matrix provides preliminary empirical support for the hypothesized positive relationships between corporate culture dimensions and employee loyalty and confirms that the variables are appropriate for subsequent multivariate analyses.
Table 6. Correlation Matrix between Variables in the Questionnaire
| CV | LS | TS | IN | ED | SR | EL | |
| CV | 1 | ||||||
| LS | .569 | 1 | |||||
| TS | .528 | .583 | 1 | ||||
| IN | .582 | .565 | .626 | 1 | |||
| ED | .482 | .543 | .574 | .520 | 1 | ||
| SR | .576 | .632 | .572 | .549 | .565 | 1 | |
| EL | .631 | .639 | .679 | .646 | .624 | .655 | 1 |
| At the 0.01 level (double tailed), the correlation is significant. | |||||||
Regression Analysis: Table 7 reports the multiple regression results testing the effects of the six corporate culture dimensions on employee loyalty. The overall model demonstrates strong explanatory power, accounting for 65.7% of the variance in employee loyalty (R² = 0.657; Adjusted R² = 0.652), which indicates a substantial level of predictive accuracy in behavioral and organizational research [41]. All six predictors exhibit statistically significant positive effects on employee loyalty (p < 0.01), providing empirical support for the hypothesized direction of influence. Specifically, in terms of standardized coefficients, team spirit (TS) shows the strongest effect (β = 0.227, t = 5.285, p < 0.001), suggesting that cooperative norms and collective cohesion are the most salient cultural driver of loyalty in this manufacturing context.
Corporate values (β = 0.174, t = 4.300, p < 0.001), employee development (β = 0.169, t = 4.260, p < 0.001), and social responsibility (β = 0.167, t = 3.882, p < 0.001) also exert comparatively strong positive influences, implying that value alignment, perceived growth opportunities, and organizational moral legitimacy are important mechanisms fostering employees’ intention to remain. Interpersonal relationships (β = 0.154, t = 3.644, p < 0.001) likewise contribute positively, highlighting the role of supportive workplace relations. Leadership remains significant but has the smallest standardized effect (β = 0.123, t = 2.876, p = 0.004), suggesting that leadership matters for loyalty, although its incremental contribution is weaker once other cultural dimensions are simultaneously considered. Overall, the results indicate that employee loyalty is jointly shaped by multiple cultural dimensions, with team-based cohesion and value and development-related perceptions emerging as particularly influential predictors.
Table 7. Regression coefficients and significance test
| Dimension | Non standardized coefficient | standardized coefficient | t | p | R² | Adjusted R² | |
| β | standard error | Beta | |||||
| CV | 0.382 | 0.089 | 0.174 | 4.300 | 0.000 | 0.657 | 0.652 |
| LS | 0.245 | 0.085 | 0.123 | 2.876 | 0.004 | ||
| TS | 0.458 | 0.087 | 0.227 | 5.285 | 0.000 | ||
| IN | 0.322 | 0.088 | 0.154 | 3.644 | 0.000 | ||
| ED | 0.342 | 0.080 | 0.169 | 4.260 | 0.000 | ||
| SR | 0.350 | 0.090 | 0.167 | 3.882 | 0.000 | ||
| Dependent variable: Employee loyalty | |||||||
One-way analysis of variance:One way ANOVA can help researchers determine whether the average differences between different groups are significant, thereby assisting researchers in interpreting and inferring experimental results. It refers to the method of verifying the impact of a single factor on research results to determine whether the tested factor will have a significant impact on the research results [44]. Table 8 presents the one-way ANOVA results comparing male and female respondents across the six corporate culture dimensions and employee loyalty. Overall, the findings indicate no statistically significant gender differences in any construct, as all p-values exceed the conventional significance threshold of 0.05 [45].
Specifically, the mean scores for corporate values, leadership, team spirit, interpersonal relationships, employee development, and social responsibility are highly comparable between male and female employees, and the F-statistics are uniformly small, suggesting minimal between-group variance relative to within-group variance. Likewise, employee loyalty shows nearly identical means for males (31.98 ± 8.755) and females (32.11 ± 8.370), with a non-significant result (F = 0.017, p = 0.895), indicating that loyalty levels are broadly consistent across genders in this sample. From an organizational perspective, these results imply that employees’ perceptions of corporate culture and their loyalty are not systematically differentiated by gender, suggesting that the cultural environment and loyalty formation mechanisms operate similarly for male and female employees within this manufacturing enterprise.
Table 8. ANOVA of Gender of Respondents
| ANOVA | Gender (mean ± standard deviation) | F | p | |
| male | female | |||
| Corporate Values | 15.27±4.010 | 15.19±3.788 | 0.03 | 0.862 |
| leadership | 15.60±4.255 | 15.25±4.579 | 0.508 | 0.476 |
| team spirit | 15.13±4.295 | 15.10±4.249 | 0.005 | 0.945 |
| interpersonal relationships | 15.48±4.132 | 15.44±4.178 | 0.009 | 0.924 |
| Employee Development | 15.43±4.172 | 14.95±4.494 | 1.029 | 0.311 |
| social responsibility | 15.57±4.188 | 15.93±3.955 | 0.609 | 0.436 |
| Employee loyalty | 31.98±8.755 | 32.11±8.370 | 0.017 | 0.895 |
Table 9 reports the one-way ANOVA results assessing whether respondents’ perceptions of the six corporate culture dimensions and employee loyalty differ across age groups. Because no respondents were aged 20 and under or 21–25, the comparisons are effectively conducted among the three represented groups (26–35, 36–45, and 46 and above). The results show that age is not a significant source of variance in any construct, as all p-values are well above the conventional threshold of 0.05 [45]. Specifically, corporate values (F = 0.422, p = 0.656), leadership (F = 0.138, p = 0.871), team spirit (F = 0.680, p = 0.507), interpersonal relationships (F = 1.295, p = 0.275), employee development (F = 0.337, p = 0.714), and social responsibility (F = 0.048, p = 0.953) exhibit no statistically meaningful differences across age categories. Employee loyalty likewise remains stable across age groups (F = 0.043, p = 0.958), with highly similar mean scores. Collectively, these findings suggest that employees’ cultural perceptions and loyalty levels are broadly consistent across the age structure represented in this manufacturing enterprise, implying that the culture–loyalty relationship operates similarly among mid-career and senior employees within the organization.
Table 9. Analysis of Variance for Age of Respondents
| ANOVA | Age (mean ± standard deviation) | F | p | ||||
| 20 years old and under | 21~25 | 26~35 | 36~45 | 46 years old and above | |||
| Corporate Values | 0 | 0 | 15.57±3.986 | 15.35±3.746 | 15.07±4.113 | 0.422 | 0.656 |
| leadership | 0 | 0 | 15.59±4.428 | 15.36±4.263 | 15.6±4.418 | 0.138 | 0.871 |
| team spirit | 0 | 0 | 14.55±4.566 | 15.07±4.244 | 15.33±4.23 | 0.68 | 0.507 |
| interpersonal relationships | 0 | 0 | 15.24±4.227 | 15.87±4.091 | 15.18±4.152 | 1.295 | 0.275 |
| Employee Development | 0 | 0 | 14.94±4.478 | 15.21±4.288 | 15.46±4.201 | 0.337 | 0.714 |
| social responsibility | 0 | 0 | 15.53±4.575 | 15.66±4.007 | 15.73±4.112 | 0.048 | 0.953 |
| Employee loyalty | 0 | 0 | 31.73±8.929 | 32.13±8.33 | 31.99±8.867 | 0.043 | 0.958 |
Table 10 reports the one-way ANOVA results examining whether perceptions of the six corporate culture dimensions and employee loyalty differ across respondents’ educational levels. Because no respondents reported postgraduate education, the effective comparisons are among four groups (junior high school and below, high school/vocational school, associate degree, and undergraduate). The findings indicate no statistically significant differences across educational levels for any construct, as all p-values exceed the conventional significance criterion of 0.05 [45]. Specifically, corporate values (F = 0.979, p = 0.403), leadership (F = 0.694, p = 0.556), team spirit (F = 0.449, p = 0.718), interpersonal relationships (F = 0.379, p = 0.768), employee development (F = 0.468, p = 0.705), and social responsibility (F = 0.838, p = 0.474) do not vary meaningfully by education. Employee loyalty similarly shows no significant group differences (F = 1.168, p = 0.322), despite modest variation in mean scores. Overall, these results suggest that employees’ evaluations of corporate culture and their loyalty are broadly consistent across educational strata within this manufacturing enterprise, implying that educational attainment does not systematically differentiate cultural perceptions or loyalty formation in this sample.
Table 10. ANOVA of Educational Level of Respondents
| ANOVA | Educational level (mean ± standard deviation) | F | p | ||||
| junior high school and below | High school or vocational school | associate degree | undergraduate | postgraduate | |||
| Corporate Values | 14.93±3.946 | 15.11±3.912 | 15.8±3.637 | 15.19±4.553 | 0 | 0.979 | 0.403 |
| leadership | 15.69±4.374 | 15.57±4.202 | 15±4.584 | 15.91±4.203 | 0 | 0.694 | 0.556 |
| team spirit | 15.19±4.293 | 15.11±4.03 | 14.8±4.662 | 15.62±4.115 | 0 | 0.449 | 0.718 |
| interpersonal relationships | 15.45±4.157 | 15.24±4.178 | 15.55±4.058 | 15.94±4.24 | 0 | 0.379 | 0.768 |
| Employee Development | 15.56±4.312 | 15.00±4.218 | 15.48±4.096 | 15.08±4.665 | 0 | 0.468 | 0.705 |
| social responsibility | 15.95±4.142 | 15.22±4.314 | 15.92±3.762 | 15.77±4.273 | 0 | 0.838 | 0.474 |
| Employee loyalty | 33.20±8.243 | 31.34±8.658 | 32.1±8.575 | 31.09±9.435 | 0 | 1.168 | 0.322 |
Table 11 presents the one-way ANOVA results assessing whether respondents’ perceptions of the six corporate culture dimensions and employee loyalty differ by years of work experience. As no respondents fell into the “within 2 years” category, the effective comparisons are among the remaining four tenure groups (2–5 years, 5–10 years, 10–20 years, and over 20 years). Overall, the results indicate that work experience does not produce statistically significant differences in any construct, as all p-values exceed the conventional threshold of 0.05 [45]. Specifically, corporate values (F = 1.816, p = 0.144), leadership (F = 0.431, p = 0.731), team spirit (F = 1.190, p = 0.313), interpersonal relationships (F = 1.406, p = 0.241), employee development (F = 0.867, p = 0.458), and social responsibility (F = 1.784, p = 0.150) show no statistically meaningful variation across tenure groups. Employee loyalty likewise remains stable across work-experience categories (F = 1.031, p = 0.379), despite modest mean differences. Collectively, these findings suggest that employees’ cultural perceptions and loyalty levels are broadly consistent across tenure groups within this organization, implying that the culture–loyalty linkage operates similarly among employees with different lengths of work experience in Chengde Lulu.
Table 11. Analysis of Variance of Respondent’s Work Experience
| ANOVA | Years of work experience (mean ± standard deviation) | F | p | ||||
| Within 2 years | 2-5 years | 5-10 years | 10-20 years | Over 20 years | |||
| Corporate Values | 0 | 17.33±2.338 | 14.26±4.148 | 15.62±3.824 | 14.96±4.04 | 1.816 | 0.144 |
| leadership | 0 | 15.33±5.203 | 14.53±4.742 | 15.68±4.356 | 15.45±4.298 | 0.431 | 0.731 |
| team spirit | 0 | 14.83±2.994 | 13.63±5.069 | 14.97±4.469 | 15.43±4.039 | 1.19 | 0.313 |
| interpersonal relationships | 0 | 15.83±3.189 | 14.11±4.864 | 15.85±4.003 | 15.24±4.207 | 1.406 | 0.241 |
| Employee Development | 0 | 16±3.578 | 14±4.096 | 15.54±4.182 | 15.19±4.379 | 0.867 | 0.458 |
| social responsibility | 0 | 15.33±4.633 | 14.32±4.619 | 16.15±3.812 | 15.41±4.3 | 1.784 | 0.15 |
| Employee loyalty | 0 | 33.83±7.757 | 28.84±8.952 | 32.35±8.485 | 31.99±8.771 | 1.031 | 0.379 |
Table 12 presents the one-way ANOVA results comparing respondents across different job positions. Overall, the findings indicate no statistically significant differences in perceptions of corporate culture dimensions or employee loyalty across job categories, as all p-values exceed the conventional significance level of 0.05. Although modest mean variations are observed—particularly for corporate values, employee development, and employee loyalty—the corresponding F-statistics do not reach statistical significance, suggesting that these differences are not systematic. Collectively, the results imply that employees’evaluations of corporate culture and their loyalty are broadly consistent across production, technical, administrative, financial, and sales positions, indicating that job position does not substantially differentiate cultural perceptions or loyalty levels within the organization.
Table 12. Analysis of Variance of Respondents’ Job Positions
| ANOVA | Job position (mean ± standard deviation) | F | p | ||||
| production personnel | technical personnel | Administrative management personnel | financial personnel | salesperson | |||
| Corporate Values | 15.06±3.8 | 16.46±3.283 | 15.8±3.915 | 11.67±4.926 | 15.3±4.1 | 2.128 | 0.077 |
| leadership | 15.54±4.364 | 15.43±4.032 | 15.55±4.334 | 14.5±3.271 | 15.5±4.452 | 0.085 | 0.987 |
| team spirit | 15.21±4.302 | 15.75±3.513 | 15.55±4.006 | 12±4.472 | 14.99±4.379 | 1.06 | 0.376 |
| interpersonal relationships | 15.59±4.243 | 16.04±3.271 | 15.65±4.404 | 12.83±5.037 | 15.32±4.104 | 0.842 | 0.499 |
| Employee Development | 15.32±4.191 | 15.96±3.543 | 14.7±5.017 | 10.33±2.733 | 15.39±4.326 | 2.354 | 0.053 |
| social responsibility | 15.83±4.09 | 16.36±3.983 | 16.15±2.777 | 12.83±4.622 | 15.45±4.273 | 1.161 | 0.327 |
| Employee loyalty | 32.32±8.369 | 33.57±8.144 | 30.6±7.943 | 23.00±9.252 | 31.93±8.926 | 2.077 | 0.083 |
According to Table 13, the one-way ANOVA method was used to examine the impact of respondents’ salary income on dimensions such as corporate values, leadership, team spirit, interpersonal relationships, employee development, social responsibility, and employee loyalty. The results showed that all p-values were higher than 0.05 and there was no significant difference. This indicates that in this survey, the impact of respondents’ salary income on corporate culture and employee loyalty is relatively small, and has no significant effect on the survey results.
Table 13. Analysis of Variance of Respondent’s Salary Income
| ANOVA | Salary income (mean ± standard deviation) | F | p | ||||
| Below 2000 yuan | 2000~4000 yuan | 4000~6000 yuan | 6000~8000 yuan | Above 8000 yuan | |||
| Corporate Values | 12.67±3.215 | 15.34±3.882 | 15.12±3.943 | 15.44±4.744 | 15.33±3.724 | 0.401 | 0.808 |
| leadership | 9.67±5.508 | 15.52±4.303 | 15.57±4.377 | 16.00±3.786 | 14.17±6.113 | 1.594 | 0.175 |
| team spirit | 10.67±4.041 | 15.25±4.126 | 14.83±4.501 | 15.96±3.867 | 15.33±5.922 | 1.273 | 0.28 |
| interpersonal relationships | 10.00±3.464 | 15.28±4.299 | 15.66±3.855 | 16.48±4.001 | 17.17±3.125 | 2.155 | 0.073 |
| Employee Development | 14.00±3.606 | 15.34±4.11 | 15.37±4.406 | 14.76±4.465 | 14.33±7.005 | 0.259 | 0.904 |
| social responsibility | 12.33±4.041 | 15.64±4.023 | 15.69±4.218 | 16.68±3.838 | 14.33±6.47 | 1.029 | 0.392 |
| Employee loyalty | 24.67±7.572 | 32.56±8.316 | 31.04±9.152 | 33.68±7.521 | 30.17±11.669 | 1.512 | 0.198 |
DISCUSSION
RO1: To explore the dimensions included in corporate culture.
This study empirically identified and validated six core dimensions of corporate culture, corporate values, leadership, team spirit, interpersonal relationships, employee development, and social responsibility, within a plant-based protein beverage manufacturing enterprise. The factor-analytic results confirmed that corporate culture is not a unidimensional construct but a structured, multidimensional system composed of distinct yet interrelated components. This finding supports the central proposition of Corporate Culture Theory that culture operates as an integrated organizational environment shaping shared meanings and behavioral expectations [11].
The identified dimensions are broadly consistent with prior corporate culture research, while also extending existing frameworks. Denison, Nieminen [46]’ s cultural framework emphasize mission, involvement, consistency, and adaptability as key cultural domains. Similarly, Monyai, Mitonga-Monga [47] argue that organizational culture comprises value orientation, leadership enactment, and social interaction patterns that jointly influence employee attitudes. This study aligns with these perspectives by confirming the importance of values, leadership, and relational dynamics, but advances the literature by explicitly differentiating team spirit and interpersonal relationships as independent cultural dimensions, rather than subsuming them under a single involvement construct.
This distinction appears particularly meaningful in manufacturing contexts characterized by high task interdependence and long-term collaboration. Ajzen [48] proposed a five-dimensional model emphasizing leadership behavior, employee development, interpersonal harmony, innovation orientation, and social responsibility. This study confirmed the relevance of most of these elements but extends the model in two important ways. First, the inclusion of corporate values restores the normative core of corporate culture, echoing arguments that value systems constitute the foundation upon which behavioral and relational practices are built [11]. Second, by treating leadership as an independent and central dimension, the model better reflects the governance structure of Chinese enterprises, where leaders play a decisive role in translating values into daily practices and shaping employees’ cultural perceptions [49].
Overall, this study contribute to corporate culture research in three ways. First, they empirically validate a six-dimensional corporate culture structure that integrates normative, relational, developmental, and social components. Second, they extend existing models by incorporating values and leadership more explicitly, enhancing theoretical completeness and contextual relevance. Third, they provide evidence that this multidimensional structure is stable across employee subgroups, supporting its applicability as a general diagnostic framework for manufacturing enterprises. Collectively, these contributions enrich the theoretical understanding of corporate culture and establish a solid foundation for examining its effects on employee-related outcomes in subsequent analyses.
RO2: To examine the impact of corporate culture on employee loyalty through empirical analysis and to examine whether employee loyalty differs significantly across demographic characteristics, including gender, age, and salary level.
This study empirically demonstrated that corporate culture exerted a significant and substantial influence on employee loyalty, while employee loyalty did not differ significantly across key demographic characteristics, including gender, age, education level, work experience, job position, and salary income. Taken together, these findings indicated that organizational cultural factors played a more decisive role than individual demographic attributes in shaping employee loyalty within a traditional manufacturing enterprise.
The regression analysis revealed that all six dimensions of corporate culture, corporate values, leadership, team spirit, interpersonal relationships, employee development, and social responsibility, had statistically significant positive effects on employee loyalty. The model exhibited strong explanatory power, suggesting that employees’ loyalty was largely shaped by their evaluations of the organizational environment rather than by isolated personal or demographic factors. This result was consistent with Corporate Culture Theory, which posits that sustained exposure to organizational values, norms, and practices cultivates employees’ affective attachment and intention to remain with the organization [11].
Among the six dimensions, team spirit emerged as the strongest predictor of employee loyalty. This finding aligned with prior studies emphasizing that collective cohesion and cooperative norms are particularly salient in manufacturing contexts, where task interdependence and coordinated production processes heighten the importance of teamwork [50]. The prominence of team spirit suggested that employee loyalty in this enterprise was deeply embedded in daily collaborative experiences, supporting the view that loyalty was socially constructed through shared work practices rather than being derived solely from formal managerial systems.
Corporate values, employee development, and social responsibility also showed relatively strong positive effects on employee loyalty. These results were consistent with value-congruence and social exchange perspectives, which argue that employees tend to remain loyal when organizational values align with their own beliefs, when long-term developmental opportunities are perceived, and when the organization demonstrates moral legitimacy and social responsibility [51, 52]. In contrast, although statistically significant, leadership exhibited a comparatively weaker standardized effect once other cultural dimensions were considered simultaneously. This pattern suggested that leadership functioned more as a transmission mechanism for values and relational norms rather than as an independent driver of loyalty, a conclusion supported by recent leadership, culture integration research [53].
This study investigated whether employee loyalty varied across demographic characteristics. The one-way ANOVA results consistently showed no statistically significant differences in employee loyalty across gender, age, education level, work experience, job position, or salary income. This finding challenged traditional assumptions that demographic factors such as tenure or compensation level constituted primary determinants of loyalty. Instead, the results supported contemporary organizational behavior research suggesting that loyalty was increasingly shaped by shared organizational experiences rather than individual background characteristics, particularly in mature manufacturing enterprises with standardized employment structures [54].
Overall, this study confirmed that employee loyalty was primarily driven by multidimensional corporate culture, with relational and value-oriented dimensions playing particularly prominent roles. Second, this study demonstrated that demographic characteristics did not significantly differentiate loyalty levels, underscoring the dominant influence of organizational context over individual background factors.
Implication of theories: This study contributed to the theoretical understanding of employee loyalty by integrating Corporate Culture Theory and Employee Loyalty Theory to examine how multidimensional corporate culture influenced employee loyalty within a traditional manufacturing enterprise. By empirically testing a localized corporate culture framework and its effects on loyalty, the study provided a more comprehensive explanation of how organizational context shaped employees’ attitudinal and behavioral outcomes.
Corporate Culture Theory posits that shared values, norms, and practices within an organization shape employees’ perceptions, behaviors, and long-term attachment to the organization [11]. In the context of this study, corporate culture was operationalized as a multidimensional construct encompassing corporate values, leadership, team spirit, interpersonal relationships, employee development, and social responsibility. The empirical findings supported this theoretical premise by demonstrating that all six dimensions of corporate culture exerted significant positive effects on employee loyalty. This result reinforced the view that corporate culture functioned as a foundational mechanism through which organizations influenced employees’ psychological identification and retention intentions.
Employee Loyalty Theory emphasizes that loyalty is not merely a function of economic exchange but is deeply rooted in employees’ emotional attachment, perceived organizational support, and value congruence [17]. This study aligned with this perspective, revealing that cultural dimensions related to collective interaction and long-term development played a prominent role in fostering employee loyalty, particularly team spirit, corporate values, and employee development. This extended existing loyalty research by empirically confirming that loyalty was shaped by employees’ holistic evaluations of the organizational environment rather than by isolated managerial practices or compensation-based incentives.
Moreover, the study revealed differentiated effects among the corporate culture dimensions, with team spirit emerging as the strongest predictor of employee loyalty. This study diverged from leadership-centric models emphasized in earlier organizational studies and suggested that, in manufacturing settings characterized by high task interdependence, collective cohesion and cooperative norms exerted a stronger influence on loyalty than hierarchical leadership alone. This study enriched Corporate Culture Theory by highlighting the contextual salience of relational and collective cultural elements, particularly in production-oriented enterprises.
In addition, this study demonstrated that employee loyalty did not differ significantly across demographic characteristics such as gender, age, education level, work experience, job position, and salary income. This study challenged demographic-deterministic assumptions prevalent in some strands of Employee Loyalty Theory, which traditionally emphasized tenure, income, or age as primary loyalty differentiators. Instead, the results suggested that when corporate culture was coherent and strongly embedded, it exerted a homogenizing effect on employees’ loyalty perceptions, thereby elevating organizational culture above individual demographic factors in explaining loyalty formation.
Taken together, by integrating Corporate Culture Theory and Employee Loyalty Theory, this study offered a theoretically grounded framework illustrating how organizational cultural attributes served as antecedents of employee loyalty. It extended existing theories by validating a localized and parsimonious corporate culture structure, demonstrating the differentiated influence of cultural dimensions on loyalty, and challenging the explanatory dominance of demographic characteristics. These contributions enriched the theoretical discourse on corporate culture and employee loyalty and expanded their applicability to traditional manufacturing enterprises in emerging economies.
Implication to practice: This study offered several practical implications for managers and policymakers in manufacturing-oriented beverage enterprises. First, this study indicated that employee loyalty was primarily shaped by multidimensional corporate culture rather than by demographic characteristics. Therefore, managers should prioritize systematic corporate culture development as a strategic tool for enhancing employee retention, instead of relying solely on compensation adjustments or demographic-based management practices.
Second, as team spirit emerged as the strongest predictor of employee loyalty, organizations should actively cultivate collaborative work environments by promoting teamwork, cross-departmental cooperation, and collective goal setting. In production-oriented enterprises, strengthening informal cooperation mechanisms and mutual support among employees may be particularly effective in fostering long-term loyalty. Third, the significant effects of corporate values, employee development, and social responsibility suggested that employees responded positively to value alignment, growth opportunities, and organizational moral commitment. Managers should therefore articulate clear corporate values, invest in continuous training and career development pathways, and integrate social responsibility initiatives into daily operations to reinforce employees’ emotional attachment to the organization.
Fourth, although leadership exhibited a relatively weaker direct effect compared to other cultural dimensions, it remained a significant driver of employee loyalty. This implied that leaders should function not only as decision-makers but also as cultural role models, consistently transmitting organizational values and supporting a positive relational climate. Finally, the absence of significant differences in employee loyalty across gender, age, education, work experience, and income levels indicated that a unified cultural strategy could be effectively applied across the workforce. Enterprises may thus adopt inclusive and standardized cultural management practices that foster shared identity and commitment among employees at all organizational levels. Overall, these practical implications underscored the importance of leveraging corporate culture as a sustainable and non-financial mechanism for strengthening employee loyalty in traditional manufacturing enterprises.
CONCLUSION
This study investigated the influence of corporate culture on employee loyalty in a plant-based protein beverage manufacturing enterprise, using Chengde Lulu as the empirical context. This study demonstrated that corporate culture was a multidimensional construct comprising corporate values, leadership, team spirit, interpersonal relationships, employee development, and social responsibility. This study confirmed that all six dimensions exerted significant positive effects on employee loyalty, with team spirit emerging as the most influential factor. Moreover, employee loyalty did not differ significantly across demographic characteristics, including gender, age, education level, work experience, job position, and salary income, indicating that organizational culture played a more decisive role than individual attributes in shaping employee loyalty.
Despite these contributions, this study was subject to several limitations. First, the data were collected from a single manufacturing enterprise, which may restrict the generalizability of the findings to other industries or organizational contexts. Second, the cross-sectional research design limited the ability to infer causal relationships between corporate culture and employee loyalty. Third, the study relied on self-reported questionnaire data, which may be subject to common method bias and social desirability effects.
Future research could address these limitations in several ways. Comparative studies across multiple enterprises or industries could be conducted to enhance external validity and examine whether the identified cultural dimensions operate similarly in different organizational contexts. Longitudinal or mixed-method research designs could be employed to capture the dynamic evolution of corporate culture and its long-term effects on employee loyalty. Additionally, future studies could incorporate mediating or moderating variables to further unpack the mechanisms through which corporate culture influences employee loyalty, such as organizational commitment, job satisfaction, or psychological safety.
Knowledge Contribution: This study made several meaningful contributions to the existing body of knowledge on corporate culture and employee loyalty, particularly within the context of traditional manufacturing enterprises in emerging economies.
First, this study advanced the conceptualization of corporate culture by developing and empirically validating a six-dimensional, localized measurement framework that integrated corporate values, leadership, team spirit, interpersonal relationships, employee development, and social responsibility. Compared with classical Western models that are often abstract or measurement-intensive, this framework demonstrated strong psychometric properties while remaining parsimonious and context-sensitive. As such, the study contributed new knowledge by bridging the gap between theoretical completeness and empirical operability, thereby enriching the localization of Corporate Culture Theory.
Second, the study extended Employee Loyalty Theory by empirically demonstrating that employee loyalty was primarily driven by organizational-level cultural factors rather than demographic characteristics. Contrary to demographic-deterministic perspectives that emphasize age, tenure, or income as key loyalty differentiators, the findings showed that a coherent and embedded corporate culture exerted a dominant and homogenizing influence on loyalty formation. This insight contributed to theory by repositioning employee loyalty as a context-dependent, socially embedded outcome rather than an individual attribute shaped mainly by personal background.
Third, the study clarified the differentiated effects of corporate culture dimensions on employee loyalty. By identifying team spirit as the most influential predictor, followed by corporate values, employee development, and social responsibility, the research moved beyond leadership-centric explanations prevalent in earlier studies. This contribution refined theoretical understanding by highlighting the central role of collective interaction and relational cohesion in loyalty formation, particularly in manufacturing environments characterized by task interdependence and collective production.
Finally, by integrating Corporate Culture Theory and Employee Loyalty Theory within a single empirical framework, this study expanded the applicability of both theories to manufacturing-oriented beverage enterprises, a context that has been underrepresented in prior research. The findings provided robust empirical evidence that corporate culture functions not merely as a symbolic construct but as a strategic organizational resource with direct implications for workforce stability and sustainable development. Collectively, these contributions advanced theoretical knowledge by localizing corporate culture measurement, redefining the drivers of employee loyalty, and extending existing theories to a new industrial and cultural context.
REFERENCES
- Liu, Z., S. Li, and J. Peng, Exploring the relationship between sugar and sugar substitutes—analysis of income level and beverage consumption market pattern based on the perspective of healthy China. Nutrients, 2022. 14(21): p. 4474.
- Liu, H., et al., Plant-Based Fermented Beverages and Key Emerging Processing Technologies. Food Reviews International, 2023. 39(8): p. 5844-5863.
- Azeem, M., et al., Expanding competitive advantage through organizational culture, knowledge sharing and organizational innovation. Technology in Society, 2021. 66: p. 101635.
- Zhang, B., et al., Well-being and its associated factors among migrant workers in food and beverage industry: a cross-sectional study in China. British Food Journal, 2022. 124(11): p. 3855-3870.
- Lu, J., et al., “Stay” or “Leave”: Influence of employee-oriented social responsibility on the turnover intention of new-generation employees. Journal of Business Research, 2023. 161: p. 113814.
- Dita, B. and S. Thrun, Organizational Commitment and Workplace Fun: Their Combined Effect on Employee Performance and Turnover Intention. 2024.p. 9.
- Kagaba, A. and K. Special, The Influence of Corporate Culture on Employee Retention. 2025. 11: p. 16-21.
- Vasumathi, A., et al., An empirical study on the impact of organizational culture dimensions on employees’ performance through organizational support in the IT industry. Social Sciences & Humanities Open, 2025. 12: p. 102054.
- Kebe, I., Y. Liu, and C. Kahl, Culturally Attuned Leadership and Employee Behavior During Organizational Change Initiatives in a Developing Economy. Behavioral Sciences, 2025. 15: p. 349.
- Iddrisu, I., Understanding the nexus between organizational culture and trust: The mediating roles of communication, leadership, and employee relationships. Sustainable Futures, 2025. 9: p. 100555.
- Gorton, G.B., J. Grennan, and A.K. Zentefis, Corporate culture. Annual Review of Financial Economics, 2022. 14(1): p. 535-561.
- Cherian, J., et al., Corporate Culture and Its Impact on Employees’ Attitude, Performance, Productivity, and Behavior: An Investigative Analysis from Selected Organizations of the United Arab Emirates (UAE). Journal of Open Innovation: Technology, Market, and Complexity, 2021. 7(1): p. 45.
- Siddiqi, K. and A. Jamal, Organizational Culture and Its Effect on Employee Motivation. Journal for Research in Applied Sciences and Biotechnology, 2024. 3: p. 249-252.
- Syarifin, M. and H. Atmaja, The Influence of Organizational Commitment, Organizational Culture and Job Satisfaction on Employee Performance: A Literature Study. Journal of Humanities Social Sciences and Business (JHSSB), 2023. 2: p. 458-467.
- Presbitero, A., Y. Fujimoto, and W.M. Lim, Employee engagement and retention in multicultural work groups: The interplay of employee and supervisory cultural intelligence. Journal of Business Research, 2025. 186: p. 115012.
- Gatell, I.S. and L. Avella, Impact of Industry 4.0 and circular economy on lean culture and leadership: Assessing digital green lean as a new concept. European Research on Management and Business Economics, 2024. 30(1): p. 100232.
- Meschke, S., The concept of employee loyalty, in Employee loyalty: Intercultural comparison of European and East Asian approaches. 2021. p. 27-72.
- Yeh, S.-H. and K.-C. Huang. The Impact of Organizational Commitment and Work Motivation on Retention Intention: Evidence from Long-Term Care Institution Caregivers Based on Expectancy Theory. In Healthcare. 2025. 13(22): p. 2832.
- So, K.K.F., Y. Yang, and X. Li, Fifteen Years of Research on Customer Loyalty Formation: A Meta-Analytic Structural Equation Model. Cornell Hospitality Quarterly, 2024. 66(2): p. 253-272.
- Zanabazar, A., M. Yondonrenchin, and E. Baljinnyam, The Impact of Leadership Styles on Employee Loyalty and Engagement. European Journal of Business and Management Research, 2023. 8: p. 94-100.
- Ketprapakorn, N. and S. Kantabutra, Toward an organizational theory of sustainability culture. Sustainable Production and Consumption, 2022. 32: p. 638-654.
- Az-Zaakiyyah, H., A. Ausat, and S. Suherlan, Corporate Culture and Employee Performance: The Role of Vision, Mission, Norms, and Employee Focus. Al Qalam: Jurnal Ilmiah Keagamaan dan Kemasyarakatan, 2024. 18: p. 2647.
- Maulana, M., Employee Loyalty : A Systematic Review of the Literature. Proceeding of International Conference on Social Science and Humanity, 2025. 2: p. 458-465.
- Zhenjing, G., et al., Impact of Employees’ Workplace Environment on Employees’ Performance: A Multi-Mediation Model. Front Public Health, 2022. 10: p. 890400.
- Michulek, J., et al., Corporate Culture, Leadership, and Pathological Relationships: A Moderated Mediation Model of Employees’ Well-Being. Administrative Sciences, 2025. 15(10): p. 399.
- Heim, I., B. Laker, and S.J. Tabaeifard, Responsible leadership: A systematic literature review, theoretical framework, and future research directions. Journal of Business Research, 2026. 203: p. 115801.
- Khaw, K.W., et al., Reactions towards organizational change: a systematic literature review. Curr Psychol, 2022: p. 1-24.
- Jun, K. and J. Lee, Transformational Leadership and Followers’ Innovative Behavior: Roles of Commitment to Change and Organizational Support for Creativity. Behav Sci (Basel), 2023. 13(4): p. 320.
- Paredes-Saavedra, M., et al., Work Team Effectiveness: Importance of Organizational Culture, Work Climate, Leadership, Creative Synergy, and Emotional Intelligence in University Employees. Administrative Sciences, 2024. 14: p. 280.
- Adham, T. and A. Sukkar, Investigating the influence of organizational culture on team management: exploring effective factors and techniques. World Journal of Advanced Research and Reviews, 2024. 22: p. 1684-1702.
- Liu, C.Y.N., Z. Lei, and M. Gan, The effects of perceived trust and psychological safety on the emotions and behaviour of hotel employees: the lens from post-COVID-19. Humanities and Social Sciences Communications, 2025. 12(1): p. 735.
- Jung, Y. and N. Takeuchi, Toward a theoretical and empirical distinction between perceived investment in employee development and perceived organizational support. Evidence-based HRM: a Global Forum for Empirical Scholarship, 2025.
- Ding, J. and G. Hong, Fostering Loyalty and Creativity: How Organizational Culture Shapes Employee Commitment and Innovation in South Korean Firms. Behavioral Sciences, 2025. 15(4): p. 529.
- Li, Y. and C.-H. Chen, The impact of employee-perceived CSR on organizational citizenship behavior ——evidence from China. Asia Pacific Management Review, 2023. 28(4): p. 487-500.
- Schaefer, S.D., et al., Employees’ positive perceptions of corporate social responsibility create beneficial outcomes for firms and their employees: Organizational pride as a mediator. Corporate Social Responsibility and Environmental Management, 2024. 31(3): p. 2574-2587.
- Mellinger, C. and T. Hanson, Methodological considerations for survey research: Validity, reliability, and quantitative analysis. Linguistica Antverpiensia, 2020. 19: p. 172-190.
- Ahmed, S.K., How to choose a sampling technique and determine sample size for research: A simplified guide for researchers. Oral Oncology Reports, 2024. 12: p. 100662.
- Memon, M., et al., Sample Size for Survey Research: Review and Recommendations. Journal of Applied Structural Equation Modeling, 2020. 4: p. 1442-1459.
- Dutta, T. and S. Dhir, Employee Loyalty: Measurement and Validation. Global Business Review, 2021. 26: p. 097215092199080.
- Bernardi, R., Validating Research Results When Cronbach’s Alpha is Below .70: A Methodological Procedure. Educational and Psychological Measurement, 2008. 54: p. 766-775.
- Hair, J.F., et al., When to use and how to report the results of PLS-SEM. European business review, 2019. 31(1): p. 2-24.
- Tavakol, M. and R. Dennick, Making sense of Cronbach’s alpha. Int J Med Educ, 2011. 2: p. 53-55.
- Kaiser, H.F., An index of factorial simplicity. Psychometrika, 1974. 39(1): p. 31-36.
- Kim, T.K., Understanding one-way ANOVA using conceptual figures. Korean J Anesthesiol, 2017. 70(1): p. 22-26.
- Kwak, S., Are Only p-Values Less Than 0.05 Significant? A p-Value Greater Than 0.05 Is Also Significant! J Lipid Atheroscler, 2023. 12(2): p. 89-95.
- Denison, D., L. Nieminen, and L. Kotrba, Diagnosing organizational cultures: A conceptual and empirical review of culture effectiveness surveys. European Journal of Work and Organizational Psychology – EUR J WORK ORGAN PSYCHOL, 2012. 23: p. 1-17.
- Monyai, D., J. Mitonga-Monga, and B. Makhubele, Organisational culture and its influence on employees’ attitude towards organisational change in a developing country setting. International Journal of Research in Business and Social Science (2147- 4478), 2024. 13: p. 11-21.
- Ajzen, I., The theory of planned behavior. Organizational behavior and human decision processes, 1991. 50(2): p. 179-211.
- Petersen, D.A. and K. Goodall, Leadership development in the cross-cultural context of China: Who really cares? International Business Review, 2025. 34(3): p. 102400.
- Sidorenkov, A.V. and E.F. Borokhovski, The Role of Cohesion and Productivity Norms in Performance and Social Effectiveness of Work Groups and Informal Subgroups. Behav Sci (Basel), 2023. 13(5): p. 361.
- Tang, X., et al., The Influence of Organizational Fairness, Identity and Empowerment on Employee Creativity: Mediating Role of Corporate Social Responsibility. Sage Open, 2025. 15(1): p. 21582440251328475.
- Meyer, K.E. and C.H. Tse, Organizational legitimacy as a core concept for theorizing on business in emerging economies. International Business Review, 2025. 34(4): p. 102447.
- Costa, D., Building a Strong Organizational Culture: Key Drivers and Best Practices. OTS Canadian Journal, 2025. 4: p. 1-15.
- Khassawneh, O. and H. Elrehail, The Effect of Participative Leadership Style on Employees’ Performance: The Contingent Role of Institutional Theory. Administrative Sciences, 2022. 12: p. 195.