1Rattanakosin International College of Creative Entrepreneurship, Rajamangala
University of Technology Rattanakosin, Nakhon Pathom, 73101, Thailand
2*Rattanakosin International College of Creative Entrepreneurship, Rajamangala University of
Technology Rattanakosin, Nakhon Pathom, 73101, Thailand.
Corresponding author emiail: nutteera.pha@rmutr.ac.th
Article Publishing History
Received: 10/02/2025
Accepted After Revision: 30/03/2025
New Energy Vehicles (NEVs) are crucial for reducing carbon emissions and facilitating sustainable energy transitions. This study investigates NEV purchase behavior in Zhengzhou using a random sampling method, collecting 344 valid responses through offline and online surveys over two months. Structural Equation Modeling (SEM) is applied to analyze key determinants. The results indicate that economic value, functional value, social value, environmental friendliness, brand reputation, and emotional resonance significantly influence NEV purchase decisions, while emotional value and functional attributes are not statistically significant. These findings suggest that besides economic and functional considerations, social recognition and brand perception play critical roles in consumer decisions. In summary, this study advances the understanding of NEV consumer behavior, integrating perceived value, brand image, and environmental influences into a structured framework. Future research should explore emerging trends such as autonomous driving, vehicle-to-grid (V2G) integration, and circular economy practices to enhance insights into sustainable mobility adoption dynamics.
New Energy Vehicles (NEVs), Consumer Behavior, Perceived Value, Brand Image, Structural Equation Modeling (SEM)
Zhang Z, Phakdeephirot N. Factors Influencing Consumers’ Behavior to Purchase New Energy Vehicles: Evidence from Zhengzhou City, China. SSN Journal of Management & Technology Research Journal. 2025;2(1).
Zhang Z, Phakdeephirot N. Factors Influencing Consumers’ Behavior to Purchase New Energy Vehicles: Evidence from Zhengzhou City, China. SSN Journal of Management & Technology Research Journal. 2025;2(1). Available from: <a href=”https://surl.li/acecyc“>https://surl.li/acecyc</a>
INTRODUCTION
The promotion of New Energy Vehicles (NEVs) has become a pivotal strategy in addressing climate change and advancing sustainable development. With the escalating severity of environmental issues, including air pollution and greenhouse gas emissions, governments worldwide have implemented policies aimed at fostering the adoption of NEVs. These vehicles not only contribute to emission reduction but also enhance energy efficiency and reduce dependence on fossil fuels, thereby facilitating the transition towards a low-carbon transportation system [1]. The United Nations’ Sustainable Development Goals (SDGs) encourage measures to lower carbon emissions, promote energy efficiency, and drive innovation in clean energy technologies [2]. The rapid development of the NEV industry in recent years has been driven by a combination of policy support, technological advancements, and increasing market demand [3]. Global NEV sales have surpassed 10 million units, with their share in the automotive market continuously rising. The European Union’s Green Deal has set a goal of phasing out internal combustion engine vehicles by 2035 [4], while the United States has introduced the Inflation Reduction Act, which provides tax incentives for electric vehicle buyers [5]. In Asia, China has emerged as the global leader in NEV development, driven by comprehensive policy frameworks, financial incentives, and large-scale infrastructure investments [6].
China’s dominance in the NEV sector is primarily attributed to sustained government support. Since the introduction of the Energy-Saving and New Energy Vehicle Industry Development Plan (2012–2020) in 2009, the Chinese government has implemented a series of measures to accelerate NEV adoption [7]. Under the nation’s Dual Carbon strategy, NEVs have been positioned as a key solution to achieving carbon neutrality. Recent policies, including the New Energy Vehicle Industry Development Plan (2021–2035), set ambitious targets, aiming for NEVs to account for 20% of total vehicle sales by 2025 [8]. Additionally, local governments have introduced targeted policies such as purchase subsidies, tax exemptions, and preferential traffic regulations to encourage NEV adoption [9]. Cities like Beijing and Shanghai have lifted purchase restrictions for NEVs while implementing incentives such as toll exemptions and dedicated parking spaces [10]. Furthermore, significant advancements have been made in charging infrastructure. By the end of 2023, China had installed over 6.5 million public charging stations, significantly improving charging accessibility and alleviating consumer concerns about range anxiety [11].
As a central transportation hub in China, Zhengzhou has made significant progress in promoting NEV adoption. The municipal government has aligned its development strategy with national policies by formulating the Zhengzhou New Energy Vehicle Industry Development Action Plan (2021–2025), which aims to reach 800,000 NEVs in operation and over 100,000 public charging stations by 2025 [12]. To facilitate NEV adoption, Zhengzhou has implemented a series of incentives, including direct purchase subsidies and funding support for charging infrastructure construction [13]. The city has also prioritized the electrification of public transportation and urban logistics. By the end of 2023, approximately 85% of Zhengzhou’s public buses were electric, and over 20,000 NEVs were in operation as ride-hailing vehicles, contributing to the expansion of the city’s green mobility network [14].
Market data further illustrate the rapid expansion of Zhengzhou’s NEV sector. In 2023, the city recorded NEV sales of 380,000 units, marking a 30% year-on-year increase, with projections to reach 520,000 units in 2024. The development of charging infrastructure has also accelerated, with over 8,000 public charging stations established by the end of 2023 [15]. Zhengzhou’s government aims to develop a one-kilometer charging network in core urban areas by 2025 to reduce consumer costs and improve charging convenience. In terms of brand competition, Zhengzhou’s NEV market is dominated by major players such as BYD, Tesla, Li Auto, and XPeng [16]. BYD maintains a strong position due to its localized production and cost-effective models, while Tesla attracts premium consumers with its technological innovations and brand prestige [17]. Emerging brands like Li Auto and XPeng have gained traction among younger consumers by offering intelligent in-car systems and extended-range battery technologies, contributing to an increasingly competitive and diversified market landscape [18].
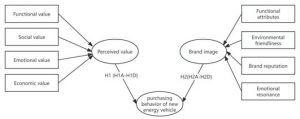
Beyond environmental benefits, the widespread adoption of NEVs has significant economic and social implications. The NEV industry drives advancements in key technological sectors such as battery innovation, smart mobility, and lightweight materials, fostering industrial upgrading and job creation [19]. The rapid development of Zhengzhou’s NEV industry has stimulated upstream and downstream sectors, including component manufacturing and after-sales services, thereby facilitating regional economic transformation [20]. Additionally, increasing NEV adoption enhances public awareness of sustainable mobility, encouraging low-carbon lifestyles. In consumer decision-making, perceived value and brand image are among the most critical determinants of NEV purchase behavior [21]. Perceived value encompasses multiple dimensions, including functional value (e.g., driving range and charging convenience), emotional value (e.g., environmental consciousness), social value (e.g., green travel identity), and economic value (e.g., purchase subsidies and cost savings) [22]. Meanwhile, brand image influences consumer trust and preference, encompassing attributes such as brand reputation, product quality, technological innovation, and corporate social responsibility [23]. Brand image not only strengthens consumer confidence but also plays a decisive role in market competitiveness [24]. Therefore, this study sets out two primary objectives:
- To determine the role of perceived value in consumers’ decision-making behavior regarding the purchase of new energy vehicles.
- To explain the influence of brand image on consumers’ decision-making behavior when purchasing new energy vehicles.
Literature review: Perceived Value Theory explains consumer choices as a balance between benefits and costs, encompassing functional, emotional, social, and economic value [24]. In the NEV context, functional value reflects driving range, charging convenience, and performance, while emotional value is linked to environmental consciousness and personal fulfillment [21]. Social value is derived from NEVs being perceived as sustainable and socially responsible choices, and economic value includes factors such as purchase subsidies and operational cost savings [21]. Understanding the role of these value dimensions provides insight into how consumers evaluate NEVs and their purchase intentions. Additionally, Brand Image Theory emphasizes the importance of brand perception in consumer trust and decision-making [25]. Given the complexity and long product lifecycle of NEVs, a strong brand image—built through technological innovation, quality assurance, after-sales services, and corporate responsibility—reduces consumer uncertainty and enhances adoption. This study examines how these branding strategies influence purchasing behavior in a highly competitive NEV market.
Environmental Behavior Theory provides a broader context for policy incentives, infrastructure development, and societal norms that shape pro-environmental behaviors [26]. NEV adoption is significantly influenced by government support, tax incentives, charging infrastructure, and social acceptance of sustainable mobility solutions. These external factors reinforce perceived value and brand trust, strengthening consumer confidence in NEV purchases [27, 28]. By integrating these theoretical frameworks, this study constructs a comprehensive model to explain consumer behavior in the NEV market, offering insights into the interplay between individual perceptions, brand influence, and environmental factors.
Perceived value is a key determinant in consumer decision-making, particularly for high-involvement products such as New Energy Vehicles (NEVs). It represents a consumer’s subjective assessment of the trade-off between the benefits obtained and the costs incurred, including financial, time, and effort-related considerations [29, 30]. Prior research has demonstrated that a higher perceived value generally enhances purchase intention, whereas a lower perceived value discourages adoption [31]. In the NEV market, perceived value encompasses not only the purchase price but also long-term costs such as maintenance, charging expenses, and government incentives, all of which influence consumer decision-making [29]. Although the impact of perceived value on consumer behavior has been widely validated in various market contexts, its role in Zhengzhou remains underexplored. Given that Zhengzhou consumers exhibit higher price sensitivity and the region’s NEV infrastructure is still developing, the influence of perceived value on NEV purchase behavior in this specific context requires further investigation [32]. Based on this, the following hypothesis is proposed:
H1: Perceived value has a positive impact on Zhengzhou consumers’ decisions to purchase new energy vehicles.
Functional value refers to consumers’ assessment of an NEV’s core performance attributes, including driving range, charging convenience, safety, power system, and intelligent technology. The continuous technological advancements in NEVs, such as extended driving ranges, faster charging speeds, and more reliable battery systems, have significantly improved functional value, enhancing consumer confidence while reducing uncertainties regarding NEV usability [33]. Functional value plays a critical role in NEV purchase decisions, with vehicle technical specifications, driving experience, and safety performance being key factors influencing consumer satisfaction and willingness to buy [34]. However, existing studies have mainly examined functional value’s impact on NEV adoption in general, without focusing on its influence in Zhengzhou [35]. Therefore, the following hypothesis is proposed:
H1a: Functional value positively influences NEV purchase decision-making behavior.
Emotional value refers to the psychological satisfaction consumers derive from purchasing an NEV, which is often linked to brand image, environmental responsibility, and alignment with personal values [28]. When consumers perceive NEVs as a reflection of their environmental commitment, their purchase intentions significantly increase [36]. Furthermore, brands that emphasize sustainability and green innovation can foster a sense of emotional connection and consumer loyalty, strengthening the perceived value of their products [37]. Thus, the following hypothesis is proposed:
H1b: Emotional value positively influences NEV purchase decision-making behavior.
Social value refers to the degree to which consumers perceive NEV ownership as a means of gaining social recognition, status, and alignment with societal trends [28]. When NEVs become widely accepted and symbolically linked to sustainability and responsible consumption, consumers are more likely to be influenced by social norms, thereby increasing their willingness to buy [38]. In China, NEV adoption is driven not only by policy incentives but also by evolving social attitudes and public discourse [39]. NEVs are increasingly perceived as a status symbol that reflects environmental consciousness and social responsibility, influencing consumer choices [34]. Based on this, the following hypothesis is proposed:
H1c: Social value positively influences NEV purchase decision-making behavior.
Economic value represents consumers’ assessment of an NEV’s financial benefits, including its purchase price, operational costs, and long-term cost savings [40]. Economic considerations are particularly influential for price-sensitive consumers, who evaluate NEV affordability based on government subsidies, fuel cost savings, and maintenance expenses [41]. Since the initial acquisition cost of NEVs is relatively high, many consumers rely on long-term financial calculations to determine whether the investment is worthwhile [42]. However, consumer sensitivity to economic value varies across different markets [43]. Therefore, the following hypothesis is proposed:
H1d: Economic value positively influences NEV purchase decision-making behavior.
Brand image plays a crucial role in shaping consumer purchase decisions, as it encompasses perceptions of product reliability, quality, emotional appeal, and corporate reputation. A strong brand image enhances consumer trust, reduces perceived risk, and increases product desirability, particularly in high-involvement purchases such as new energy vehicles [44]. In the market for new energy vehicles, brand image is especially significant due to the technological complexity of these automobiles and lingering consumer concerns regarding performance, battery longevity, and resale value [45]. A well-established brand image positively affects consumer confidence and increases the likelihood of adopting emerging technologies [46]. However, while the relationship between brand image and purchase behavior has been extensively examined in mature automotive markets, its specific impact on consumer decision-making in the new energy vehicle market in Zhengzhou remains insufficiently explored [47]. Based on this, the following hypothesis is proposed:
H2: Brand image positively influences the purchase decision-making behavior of new energy vehicles.
Functional attributes refer to the core characteristics of a product that define its performance, quality, and usability, particularly in technology-intensive industries such as the new energy vehicle sector [48]. Key functional attributes, including battery efficiency, driving range, and charging speed, are critical determinants of consumer evaluations and purchase decisions [49]. Brands that deliver superior functional performance are perceived as more trustworthy and technologically advanced, thereby reinforcing consumer confidence and increasing the likelihood of purchase [50]. In the context of the new energy vehicle industry, manufacturers that consistently introduce innovations in vehicle safety, energy efficiency, and autonomous driving technology strengthen their competitive positioning and foster consumer preference [35]. Therefore, the following hypothesis is proposed:
H2a: Functional attributes positively influence the purchase decision-making behavior of new energy vehicles.
Environmental friendliness represents a brand’s commitment to sustainability and eco-friendly innovation, which has been shown to significantly impact consumer attitudes toward new energy vehicles [51]. Studies have found that consumers who prioritize environmental concerns tend to favor brands that align with their sustainability values, reinforcing both brand loyalty and purchase intention [52]. The perception of environmental friendliness strengthens a brand’s reputation by fostering a positive emotional connection with consumers who are inclined toward pro-environmental behavior [53]. Furthermore, research suggests that consumers perceive environmentally responsible brands as more ethical and forward-thinking, increasing their preference for these brands over competitors [54]. Although environmental friendliness has been widely studied as a key factor in shaping sustainable consumer behavior, its role in influencing new energy vehicle adoption in Zhengzhou remains underexamined [55]. Based on this, the following hypothesis is proposed:
H2b: Environmental friendliness positively influences the purchase decision-making behavior of new energy vehicles.
Brand reputation encompasses consumer perceptions of corporate reliability, ethical business practices, and long-term credibility, all of which significantly shape consumer trust and purchase behavior [56]. A strong brand reputation enhances consumer confidence in product quality and encourages greater willingness to adopt innovative technologies such as new energy vehicles [38]. Companies that emphasize corporate social responsibility, sustainable business practices, and high-quality manufacturing standards tend to cultivate a favorable market reputation, thereby strengthening consumer trust [57]. Furthermore, a positive brand reputation helps mitigate consumer uncertainty, particularly in emerging industries where potential buyers seek reassurance regarding product reliability and long-term value [58]. Therefore, the following hypothesis is proposed:
H2c: Brand reputation positively influences the purchase decision-making behavior of new energy vehicles.
Emotional resonance refers to the connection consumers develop with a brand through shared values, identity alignment, and personal attachment. Bbrands capable of fostering emotional engagement generate stronger consumer loyalty and long-term brand advocacy [59]. In the context of the new energy vehicle industry, brands that effectively communicate sustainability values, corporate social responsibility, and technological innovation enhance emotional resonance, which in turn strengthens consumer commitment and increases the likelihood of purchase [60]. Emotional branding deepens consumer relationships with a brand, making it more appealing to environmentally conscious buyers who seek meaning and identity in their purchasing decisions [61]. Based on this, the following hypothesis is proposed:
H2d: Emotional resonance positively influences the purchase decision-making behavior of new energy vehicles.
Hence, this study develops figure 1.
Figure 1. Empirical model
METHODLOGY
This study employs a quantitative research methodology to systematically analyze the key factors influencing consumer decisions to purchase new energy vehicles in Zhengzhou. As a central economic hub in China, Zhengzhou has a well-established new energy vehicle market, supported by favorable policies and infrastructure development, making it an ideal region for studying consumer behavior in this sector. Data collection for this study was conducted using a structured questionnaire survey over a period of two months, ensuring comprehensive coverage of consumer decision-making behaviors across different time frames and enhancing the representativeness of the dataset.
To ensure a representative sample, this study adopted a random sampling method, targeting consumers from diverse age groups, occupations, and income levels. During data collection, questionnaires were distributed offline at key locations such as new energy vehicle 4S stores, auto exhibitions, and charging stations to capture feedback from consumers actively engaged in the car-buying process. Additionally, the study employed online questionnaire distribution through social media platforms and forums related to new energy vehicles to expand the sample reach. Ultimately, a total of 344 valid questionnaires were collected, ensuring broad coverage and diversity within the dataset.
The survey instrument consisted of three primary sections, each designed to comprehensively assess the factors influencing new energy vehicle purchase behavior. The first section gathered demographic information, including gender, age, education level, income, vehicle ownership history, brand preference, and purchase price range, to examine how different consumer groups vary in their attitudes toward new energy vehicles. The second section measured perceived value, which includes four dimensions: functional value, emotional value, social value, and economic value. The measurement items in this section were adapted from the Perceived Value Scale (PERVAL) developed by Gallarza, Maubisson [62] and revised to align with the characteristics of the new energy vehicle market. The third section evaluated brand image and purchase behavior, examining how consumer perceptions of brand reliability, environmental responsibility, and emotional appeal influence their purchase decisions. The measurement items in this section were developed based on the brand image models proposed by Aaker [63] and Keller [64], with modifications tailored to the new energy vehicle market. All constructs in the questionnaire were measured using a five-point Likert scale (1 = Strongly Disagree, 5 = Strongly Agree) to ensure precision and comparability in data analysis.
Before the main survey, a pretest was conducted to assess the reliability and validity of the questionnaire and refine its design. A total of 30 valid responses were collected from new energy vehicle consumers in Zhengzhou, ensuring diverse representation across different age groups, occupations, and income levels. After data screening, a reliability and validity analysis was performed. The reliability analysis was conducted using Cronbach’s α coefficient to assess the internal consistency of the measurement items, with all Cronbach’s α values exceeding 0.7, indicating high reliability [65]. Specifically, constructs such as environmental friendliness (0.923), social value (0.906), and economic value (0.902) demonstrated strong internal consistency, reflecting high correlation among measurement items. Additionally, emotional resonance (0.878) and functional value (0.881) also exhibited high reliability, further validating the stability and robustness of the questionnaire.
RESULTS
Sample information: Table 1 provides an overview of the demographic composition and purchasing behavior of respondents. The demographic composition and purchasing behavior of respondents present a balanced gender distribution, with 49.7% male and 50.3% female participants. Most respondents fall within their prime earning years (21-50 years old), accounting for 83.5% of the sample, while younger individuals (below 20, 2.6%) and older consumers (above 51, 14.0%) make up smaller proportions. Regarding education, bachelor’s degree holders constitute the largest group (29.9%), followed by high school graduates (27.0%) and vocational college attendees (25.3%), while advanced degree holders (master’s 8.4%, Ph.D. 9.3%) form a smaller but highly educated segment.
In terms of brand preference, Tesla and Li Auto are the most popular choices (16.9% each), followed by Wuling (11.3%), BYD (10.5%), and NIO (8.7%), with other brands also holding notable market shares. Most respondents purchased mid-to-upper-priced NEVs, with 26.5% spending 300,001–400,000 CNY and 25.3% selecting vehicles priced between 100,000–200,000 CNY. The key purchase drivers include owner discount policies (18.0%), brand preference (16.3%), vehicle performance (12.8%), charging convenience (12.5%), and environmental benefits (9.0%), while 20.3% cited additional motivations. These insights highlight the complex interplay of financial incentives, brand reputation, and functional considerations in shaping NEV purchase behavior.
Table 1. Sample Information.
| Information and options | Frequency | Percent | |
| Gender | Male | 171 | 49.7 |
| Female | 173 | 50.3 | |
| Age | Below 20 | 9 | 2.6 |
| 21-30 | 102 | 29.7 | |
| 31-40 | 87 | 25.3 | |
| 41-50 | 98 | 28.5 | |
| 51 and above | 48 | 14.0 | |
| Educational Level | High school or below | 93 | 27.0 |
| Vocational college | 87 | 25.3 | |
| Bachelor’s Degree | 103 | 29.9 | |
| Master’s Degree | 29 | 8.4 | |
| Ph.D. or above | 32 | 9.3 | |
| Brands of new energy vehicles you have purchased | Tesla | 58 | 16.9 |
| BYD | 36 | 10.5 | |
| Li Auto | 58 | 16.9 | |
| Xpeng | 29 | 8.4 | |
| NIO | 30 | 8.7 | |
| GAC Aion | 26 | 7.6 | |
| Changan | 31 | 9.0 | |
| Wuling | 39 | 11.3 | |
| Others | 37 | 10.8 | |
| Price range of the new energy vehicle you purchased | Below 100,000 CNY | 52 | 15.1 |
| 100,000-200,000 CNY | 87 | 25.3 | |
| 200,001-300,000 CNY | 68 | 19.8 | |
| 300,001-400,000 CNY | 91 | 26.5 | |
| Above 400,000 CNY | 46 | 13.4 | |
| How often do you use AI chatbots? | Energy-saving and environmental protection | 31 | 9.0 |
| Car purchase subsidy | 38 | 11.0 | |
| Convenient charging | 43 | 12.5 | |
| Vehicle performance | 44 | 12.8 | |
| Owner discount policies | 62 | 18.0 | |
| Brand preference | 56 | 16.3 | |
| Others | 70 | 20.3 | |
Descriptive statistics: The descriptive statistics provide an overview of the central tendencies and distributions of key variables, reflecting respondents’ perceptions of new energy vehicles (NEVs). The mean values range from 3.40 to 3.56, suggesting a moderate level of agreement among respondents regarding functional value, social value, emotional value, economic value, brand image, and purchasing behavior. The highest mean values are observed for purchasing behavior (3.56) and emotional resonance (3.55), indicating that respondents demonstrate a strong inclination toward recommending and purchasing NEVs. In contrast, economic value (3.44) and environmental friendliness (3.44) received the lowest scores, suggesting that financial and ecological benefits are perceived as less influential in the decision-making process.
The standard deviations range from 1.02 to 1.12, indicating moderate response variability. Higher variability is observed for functional attributes (1.12) and economic value (1.09), suggesting diverse opinions on these aspects, while functional value (1.03) and environmental friendliness (1.02) exhibit lower standard deviations, reflecting more consistent responses. The skewness values are all negative, ranging from -0.737 to -0.481, indicating that respondents tend to rate variables above the mean, reflecting an overall positive perception. Additionally, kurtosis values remain below zero, signifying a flat distribution, where responses are more spread out rather than concentrated around a specific rating. These findings highlight the importance of brand reputation and emotional connections in shaping consumer attitudes toward NEVs, alongside functional and economic considerations.
Table 2. Descriptive Statistics Results
| Study variables | Items | Mean | S.D. | Skewness | Kurtosis | ||
| Value | S.E. | Value | S.E. | ||||
| Functional Value | FV1 | 3.490 | 1.061 | -0.574 | 0.131 | -0.682 | 0.262 |
| FV2 | 3.460 | 1.103 | -0.544 | 0.131 | -0.743 | 0.262 | |
| FV3 | 3.470 | 1.038 | -0.646 | 0.131 | -0.516 | 0.262 | |
| Social Value | SV1 | 3.490 | 1.047 | -0.590 | 0.131 | -0.617 | 0.262 |
| SV2 | 3.510 | 1.036 | -0.617 | 0.131 | -0.576 | 0.262 | |
| SV3 | 3.510 | 1.077 | -0.550 | 0.131 | -0.667 | 0.262 | |
| SV4 | 3.490 | 1.004 | -0.514 | 0.131 | -0.807 | 0.262 | |
| Emotional Value | EV1 | 3.470 | 1.033 | -0.681 | 0.131 | -0.466 | 0.262 |
| EV2 | 3.460 | 1.060 | -0.594 | 0.131 | -0.632 | 0.262 | |
| EV3 | 3.490 | 1.052 | -0.611 | 0.131 | -0.587 | 0.262 | |
| Economic Value | ECV1 | 3.480 | 1.093 | -0.708 | 0.131 | -0.514 | 0.262 |
| ECV2 | 3.440 | 1.076 | -0.492 | 0.131 | -0.891 | 0.262 | |
| ECV3 | 3.460 | 1.057 | -0.607 | 0.131 | -0.676 | 0.262 | |
| ECV4 | 3.520 | 1.033 | -0.630 | 0.131 | -0.596 | 0.262 | |
| Functional Attribute | FA1 | 3.480 | 1.122 | -0.610 | 0.131 | -0.644 | 0.262 |
| FA2 | 3.420 | 1.041 | -0.601 | 0.131 | -0.782 | 0.262 | |
| FA3 | 3.490 | 1.024 | -0.532 | 0.131 | -0.619 | 0.262 | |
| FA4 | 3.490 | 1.047 | -0.667 | 0.131 | -0.606 | 0.262 | |
| Environmental Friendliness | EF1 | 3.480 | 1.024 | -0.535 | 0.131 | -0.721 | 0.262 |
| EF2 | 3.450 | 1.092 | -0.481 | 0.131 | -0.893 | 0.262 | |
| EF3 | 3.470 | 1.021 | -0.616 | 0.131 | -0.549 | 0.262 | |
| EF4 | 3.440 | 1.068 | -0.658 | 0.131 | -0.617 | 0.262 | |
| Brand Reputation | BR1 | 3.490 | 1.050 | -0.600 | 0.131 | -0.697 | 0.262 |
| BR2 | 3.480 | 1.096 | -0.536 | 0.131 | -0.711 | 0.262 | |
| BR3 | 3.410 | 1.054 | -0.737 | 0.131 | -0.439 | 0.262 | |
| BR4 | 3.510 | 1.052 | -0.665 | 0.131 | -0.523 | 0.262 | |
| Emotional Resonance | ER1 | 3.550 | 1.071 | -0.523 | 0.131 | -0.726 | 0.262 |
| ER2 | 3.450 | 1.032 | -0.604 | 0.131 | -0.640 | 0.262 | |
| ER3 | 3.490 | 1.055 | -0.554 | 0.131 | -0.701 | 0.262 | |
| ER4 | 3.500 | 1.058 | -0.602 | 0.131 | -0.644 | 0.262 | |
| Purchasing behavior of new energy vehicles | PB1 | 3.470 | 1.027 | -0.556 | 0.131 | -0.634 | 0.262 |
| PB2 | 3.560 | 1.056 | -0.699 | 0.131 | -0.477 | 0.262 | |
| PB3 | 3.490 | 1.072 | -0.606 | 0.131 | -0.673 | 0.262 | |
Data availability analysis: Reliability analysis evaluates the internal consistency of measurement constructs, ensuring that the questionnaire items accurately reflect the intended dimensions of each variable. Table 3 presents Cronbach’s α values for all study variables, a widely used reliability coefficient that measures how well the items within each construct are correlated. A Cronbach’s α value above 0.7 is generally considered acceptable, indicating a reliable measurement scale. The results confirm that all study variables meet or exceed this threshold, demonstrating high internal consistency.
The highest reliability scores are observed for Brand Reputation (0.879), Environmental Friendliness (0.870), and Emotional Resonance (0.865), indicating that these constructs exhibit particularly strong alignment among their respective items. Similarly, Social Value (0.863) and Economic Value (0.860) display robust internal consistency, supporting their validity in capturing consumer perceptions related to social and financial considerations. Other constructs, including Functional Value (0.822) and Emotional Value (0.815), also demonstrate satisfactory reliability, suggesting that respondents provided consistent responses when evaluating these dimensions. Additionally, the Purchasing Behavior of New Energy Vehicles (0.836) shows strong internal consistency, reinforcing the reliability of this key outcome variable.
Table 3. Reliability Statistics
Factor analysis requires an evaluation of the dataset’s suitability to ensure that variables exhibit sufficient intercorrelation for meaningful extraction of latent constructs. Table 4 presents the Kaiser-Meyer-Olkin (KMO) Measure of Sampling Adequacy and Bartlett’s Test of Sphericity, two key statistical tests that assess the appropriateness of the data for factor analysis. The KMO value is 0.919, which exceeds the commonly accepted threshold of 0.7, indicating a high degree of sampling adequacy. A KMO value above 0.9 is considered excellent, suggesting that the dataset contains substantial shared variance among variables, making it well-suited for factor extraction and multivariate statistical analysis.
This high value underscores the robustness of the dataset for subsequent analyses. Bartlett’s Test of Sphericity further validates the dataset’s suitability, yielding a Chi-Square value of 6126.972, with 528 degrees of freedom (df) and a significance level (Sig. = 0.000). The significant result confirms that the correlation matrix is not an identity matrix, indicating the presence of meaningful relationships among variables. This supports the appropriateness of conducting factor analysis, as the dataset exhibits strong inter-item correlations necessary for the identification of latent constructs.
Table 4. KMO and Bartlett’s Test.
| Kaiser-Meyer-Olkin Measure of Sampling Adequacy. | .919 | |
|
Bartlett’s Test of Sphericity |
Approx. Chi-Square | 6126.972 |
| Df | 528 | |
| Sig. | .000 | |
Measurement model and fit metrics: Figure 2 illustrates a measurement model within the confirmatory factor analysis framework.
Figure 2: Measurement model
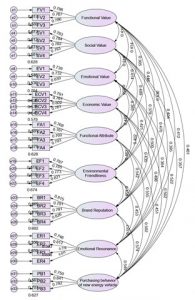
Table 5 presents the fit indices used to evaluate how well the measurement model aligns with the observed data. These indices assess the model’s overall goodness-of-fit, ensuring that it accurately represents the relationships among the study variables.
The chi-square to degrees of freedom ratio (χ²/df) is 1.082, which is well below the reference standard of 3, indicating an excellent model fit. A lower value suggests that the discrepancy between the proposed model and the actual data is minimal, reinforcing the validity of the model’s structure. The Root Mean Square Error of Approximation (RMSEA) is 0.015, significantly below the commonly accepted threshold of 0.08. This result indicates that the model has very low approximation errors, suggesting a close fit between the observed data and the hypothesized structure.
Several additional goodness-of-fit indices further confirm the robustness of the measurement model. The Goodness-of-Fit Index (GFI = 0.922) and the Adjusted Goodness-of-Fit Index (AGFI = 0.905) both exceed the 0.9 benchmark, demonstrating that the model sufficiently explains the data variance. The Normed Fit Index (NFI = 0.922), Tucker-Lewis Index (TLI = 0.993), and Comparative Fit Index (CFI = 0.994) all surpass the 0.9 threshold, indicating strong relative fit and alignment with the theoretical framework.
Table 5. Measure model fit index
| Fit index | χ2/df | RMSEA | GFI | AGFI | NFI | TLI | CFI |
| Reference standards | <3 | <0.08 | >0.9 | >0.9 | >0.9 | >0.9 | >0.9 |
| Result | 1.082 | 0.015 | 0.922 | 0.905 | 0.922 | 0.993 | 0.994 |
Convergent validity: Table 6 evaluates convergent validity through Confirmatory Factor Analysis (CFA), using factor loadings, Composite Reliability (CR), and Average Variance Extracted (AVE) to assess measurement consistency. All factor loadings exceed 0.7, confirming strong associations between observed variables and latent constructs. The highest loading is EV3 (0.839) under Emotional Value, while the lowest is EV2 (0.732), both within acceptable limits.CR values range from 0.815 to 0.876, surpassing the 0.7 threshold, indicating high internal reliability. Environmental Friendliness (0.876), Brand Reputation (0.866), and Emotional Resonance (0.870) exhibit the highest consistency. AVE values range from 0.595 to 0.638, exceeding the 0.5 benchmark, ensuring that each construct explains more than half of the variance in its indicators. Environmental Friendliness (0.638) and Brand Reputation (0.619) demonstrate the strongest explanatory power. These results validate the robustness of the measurement model, confirming that all constructs are reliably captured.
Table 6. Convergence Validity
| Latent variables | Observation indicators | Factor loading | CR | AVE |
| Functional Value | FV1 | 0.786 | 0.823 | 0.608 |
| FV2 | 0.767 | |||
| FV3 | 0.786 | |||
| Social Value | SV1 | 0.783 | 0.864 | 0.613 |
| SV2 | 0.794 | |||
| SV3 | 0.762 | |||
| SV4 | 0.793 | |||
| Emotional Value | EV1 | 0.739 | 0.815 | 0.595 |
| EV2 | 0.732 | |||
| EV3 | 0.839 | |||
| Economic Value | ECV1 | 0.791 | 0.861 | 0.607 |
| ECV2 | 0.761 | |||
| ECV3 | 0.802 | |||
| ECV4 | 0.761 | |||
| Functional Attribute | FA1 | 0.767 | 0.859 | 0.604 |
| FA2 | 0.760 | |||
| FA3 | 0.793 | |||
| FA4 | 0.787 | |||
| Environmental Friendliness | EF1 | 0.785 | 0.876 | 0.638 |
| EF2 | 0.773 | |||
| EF3 | 0.821 | |||
| EF4 | 0.815 | |||
| Brand Reputation | BR1 | 0.781 | 0.866 | 0.619 |
| BR2 | 0.791 | |||
| BR3 | 0.826 | |||
| BR4 | 0.746 | |||
| Emotional Resonance | ER1 | 0.812 | 0.870 | 0.625 |
| ER2 | 0.770 | |||
| ER3 | 0.811 | |||
| ER4 | 0.769 | |||
| Purchasing behavior of new energy vehicle | PB1 | 0.750 | 0.837 | 0.632 |
| PB2 | 0.841 | |||
| PB3 | 0.792 |
Discriminant validity: Table 7 evaluates discriminant validity, ensuring each latent variable is distinct and captures unique theoretical aspects. The diagonal values represent the square root of Average Variance Extracted (AVE) and should exceed the off-diagonal correlation coefficients. The results confirm that all constructs share more variance with their respective indicators than with others, validating their distinctiveness.Correlation coefficients range from 0.305 to 0.574, indicating moderate interrelationships while maintaining construct independence. Notably, Purchasing Behavior of New Energy Vehicles shows moderate correlations with Brand Reputation (0.574) and Emotional Value (0.522), suggesting that brand perception and emotional attachment influence purchase decisions. These findings confirm the robustness of the measurement model, ensuring its reliability for structural equation modeling and hypothesis testing.
Table 7. Discriminant Validity Test
| Latent variables | FV | SV | EV | ECV | FA | EF | BR | ER | PB |
| Functional Value | 0.780 | ||||||||
| Social Value | 0.411 | 0.783 | |||||||
| Emotional Value | 0.414 | 0.314 | 0.771 | ||||||
| Economic Value | 0.305 | 0.414 | 0.534 | 0.779 | |||||
| Functional Attribute | 0.446 | 0.489 | 0.385 | 0.479 | 0.777 | ||||
| Environmental Friendliness | 0.436 | 0.379 | 0.421 | 0.402 | 0.462 | 0.799 | |||
| Brand Reputation | 0.404 | 0.470 | 0.500 | 0.435 | 0.542 | 0.458 | 0.787 | ||
| Emotional Resonance | 0.412 | 0.395 | 0.364 | 0.496 | 0.555 | 0.453 | 0.557 | 0.791 | |
| Purchasing behavior of new energy vehicle | 0.461 | 0.357 | 0.522 | 0.502 | 0.451 | 0.502 | 0.574 | 0.549 | 0.795 |
| Note: The diagonal is the square root of the corresponding variable’s AVE.
FV: Functional Value; SV: Social Value; EV: Emotional Value; ECV: Economic Value; FA: Functional Attribute; EF: Environmental Friendliness; BR: Brand Reputation; ER: Emotional Resonance; PB: Purchasing behavior of new energy vehicle. |
|||||||||
Structural model fit metrics for the structural model
Figure 3 illustrates the structural equation model and path analysis diagram.
Figure 3: Structural model.
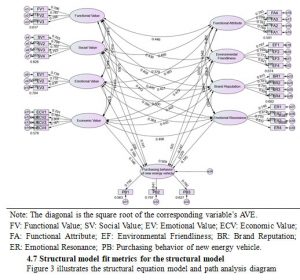
Table 8 presents the model fit indices, confirming the structural model’s robustness. The chi-square to degrees of freedom ratio (χ²/df) = 1.082, well below the threshold of 3, indicates minimal discrepancy between the observed and expected covariance structures. The Root Mean Square Error of Approximation (RMSEA) = 0.015, significantly below 0.08, further validates the model’s fit.Additional indices, including GFI (0.922), AGFI (0.905), NFI (0.922), TLI (0.993), and CFI (0.994), all exceed the 0.9 benchmark, confirming a strong alignment with theoretical expectations. These results affirm that the model effectively explains NEV purchasing behavior, supporting the proposed relationships among key variables.
Table 8. Model fit index
| Fit index | χ2/df | RMSEA | GFI | AGFI | NFI | TLI | CFI |
| Reference standards | <3 | <0.08 | >0.9 | >0.9 | >0.9 | >0.9 | >0.9 |
| Result | 1.082 | 0.015 | 0.922 | 0.905 | 0.922 | 0.993 | 0.994 |
Path analysis for direct effects: Table 9 presents the direct path effects within the structural model, evaluating the influence of perceived value and brand image dimensions on NEV purchasing behavior. Significant positive effects are observed for functional value (β = 0.141, p = 0.034), social value (β = 0.160, p = 0.027), economic value (β = 0.146, p = 0.041), environmental friendliness (β = 0.147, p = 0.022), brand reputation (β = 0.229, p = 0.002), and emotional resonance (β = 0.195, p = 0.007), highlighting the role of both product attributes and brand perceptions in influencing consumer decisions.Conversely, emotional value (β = -0.039, p = 0.538) and functional attribute (β = -0.025, p = 0.732) do not exhibit significant relationships, indicating that emotional attachment and specific functional attributes are not decisive factors for adoption. These findings reinforce that both economic and brand-related factors shape purchasing behavior, confirming the theoretical model’s validity.
Table 9. Direct path effects.
DISCUSSION
Theoretical influence: This study examines the factors influencing NEV purchasing behavior, focusing on perceived value and brand image. Structural equation modeling results indicate that economic value, social value, brand reputation, and emotional resonance significantly impact purchasing behavior, while emotional value and functional attributes do not. Additionally, environmental friendliness strengthens brand trust, indirectly shaping consumer decision-making. These findings refine existing theories in consumer behavior, branding, and environmental psychology.
Building on Perceived Value Theory, this study highlights social and economic value as primary drivers of NEV adoption, while emotional value plays a lesser role in markets where cost and infrastructure remain critical concerns. Unlike previous studies suggesting emotional value enhances green product adoption [66], this study finds it insignificant in NEV purchases. Additionally, while prior research emphasizes functional attributes like battery life and charging convenience, this study finds brand trust and social influence more decisive in consumer choices [67].
This study also extends Brand Image Theory by demonstrating that brand reputation, emotional resonance, and environmental friendliness strongly influence purchasing behavior. Prior research mainly highlights brand awareness and technological superiority [68], but these findings suggest that corporate social responsibility and sustainability messaging enhance brand trust and drive purchase intention. Additionally, brand reputation mitigates perceived risks, influencing consumer behavior independently of technological innovation [46, 69].
Further, this study refines the Consumer Behavior Model by revealing the importance of social recognition and brand trust in shaping consumer decisions. Prior studies primarily focus on economic and policy-driven incentives [70], while this study emphasizes that social value and branding significantly influence the evaluation stage of NEV adoption. This challenges traditional views of NEV adoption as purely rational economic behavior, highlighting the growing role of social influence and branding in sustainable consumption [61].
Additionally, this study contributes to Environmental Behavior Theory by demonstrating that environmental friendliness indirectly influences purchasing behavior via brand trust. While prior research debates whether regulatory incentives or intrinsic environmental concerns drive green consumption [71, 72], this study supports a hybrid model, where corporate sustainability efforts reinforce consumer trust and purchase intention. This aligns with findings that environmentally responsible branding enhances consumer loyalty but further demonstrates that brand trust mediates this effect [73].
In summary, this study refines Perceived Value Theory by emphasizing social and economic value over emotional and functional value, extends Brand Image Theory by highlighting brand reputation and emotional resonance, advances the Consumer Behavior Model by illustrating the role of branding and social value, and strengthens Environmental Behavior Theory by confirming the impact of environmental friendliness on brand trust and consumer commitment. These insights contribute to the literature on sustainable consumption and NEV adoption, providing a foundation for future research on consumer preferences in low-carbon mobility markets.
Practice influence: The findings have significant practical implications for policymakers, industry stakeholders, and consumers, providing actionable insights for the sustainable development of the new energy vehicle (NEV) market. Given the demonstrated influence of economic value on purchasing behavior, government policies should continue to refine financial incentives, extending beyond direct subsidies to include long-term benefits such as tax exemptions, reduced insurance premiums, and charging infrastructure subsidies. These measures can enhance the perceived affordability and long-term cost efficiency of NEVs, mitigating consumers’ financial concerns. Additionally, as environmental friendliness has been shown to influence consumer trust in NEV brands, regulatory authorities should implement stricter sustainability standards and encourage automakers to invest in eco-friendly production processes, such as battery recycling initiatives and carbon-neutral manufacturing.
Concurrently, improvements in charging infrastructure remain crucial, particularly in second-tier cities like Zhengzhou, where limited accessibility to charging stations may hinder adoption. Public-private partnerships should be leveraged to accelerate infrastructure development, integrating charging networks within residential, commercial, and highway sectors to enhance the functional value of NEVs and alleviate range anxiety among potential buyers.
From a corporate perspective, the findings underscore the importance of brand reputation and emotional resonance in shaping consumer preferences. NEV manufacturers should focus on strategic brand positioning, emphasizing technological innovation, product reliability, and corporate social responsibility to build consumer trust. Marketing campaigns should leverage digital platforms and social media engagement to enhance consumer-brand interactions, fostering emotional connections that drive long-term brand loyalty. Furthermore, companies should optimize post-purchase support by offering extended battery warranties, resale value guarantees, and comprehensive after-sales services to reinforce consumer confidence. Social influence also plays a critical role in consumer decision-making, suggesting that industry stakeholders should cultivate community-based marketing strategies, such as influencer partnerships and consumer advocacy programs, to enhance the social desirability of NEVs.
Lastly, shared mobility solutions, such as NEV-based ride-hailing and car-sharing services, should be expanded to increase consumer exposure and familiarity with electric vehicles, thereby strengthening their perceived functional and economic value. By integrating these strategies, both policymakers and industry leaders can effectively accelerate the transition toward sustainable mobility and foster widespread adoption of NEVs in urban markets.
CONCLUSION
This study confirms that functional value, social value, economic value, environmental friendliness, brand reputation, and emotional resonance significantly influence purchase behavior, while emotional value and functional attributes do not. These results highlight the interplay between product-related factors and brand perception in shaping consumer decisions. The study provides a holistic view of NEV adoption, emphasizing the role of social value and environmental consciousness in shaping consumer choices, particularly in emerging NEV markets. Practically, the findings offer insights for policymakers, industry stakeholders, and marketers. Governments should refine financial incentives and infrastructure policies to enhance perceived economic and functional value. Automakers should strengthen brand reputation through technological reliability, customer service, and corporate social responsibility. Marketing strategies should leverage social influence, engaging digital communities and sustainability advocates to promote NEVs as lifestyle choices. Additionally, charging infrastructure improvements and targeted promotions can accelerate market penetration.
Despite its contributions, this study has limitations. The focus on Zhengzhou limits generalizability; future research should conduct comparative city-level analyses. The cross-sectional design captures consumer perceptions at one point in time, necessitating longitudinal studies to track preference shifts due to policy and technological changes. Future research should also incorporate behavioral data (e.g., purchase records, charging patterns) to validate findings. Additionally, exploring risk perception and trust in autonomous driving technology could provide deeper insights into next-generation NEV adoption.
In summary, this study advances the understanding of NEV consumer behavior, integrating perceived value, brand image, and environmental influences into a structured framework. Future research should explore emerging trends such as autonomous driving, vehicle-to-grid (V2G) integration, and circular economy practices to enhance insights into sustainable mobility adoption dynamics.
Data Availability: Data are available with the corresponding author on a reasonable request.
Conflict of interest statement: Authors declare no competing interests
Funding: Nil
REFERENCES
- Hossain, M.S., et al., Narrowing fossil fuel consumption in the Indian road transport sector towards reaching carbon neutrality. Energy Policy, 2023. 172: p. 113330.
- Zakari, A., et al., Energy efficiency and sustainable development goals (SDGs). Energy, 2022. 239: p. 122365.
- Hu, R., T. Cai, and W. Xu, Exploring the technology changes of new energy vehicles in China: Evolution and trends. Computers & Industrial Engineering, 2024. 191: p. 110178.
- Möring-Martínez, G., M. Senzeybek, and P. Jochem, Clustering the European Union electric vehicle markets: A scenario analysis until 2035. Transportation Research Part D: Transport and Environment, 2024. 135: p. 104372.
- Nam, S., Inflation Reduction Act’s Clean Vehicle Provisions: Analysis of Potential International Trade Law Violations, in Revolutionary Approach to International Law: The Role of International Lawyer in Asia, E.Y.J. Lee, Editor. 2023, Springer Nature Singapore: Singapore. p. 177-195.
- Liu, Z., S. Schindler, and W. Liu, Demystifying Chinese overseas investment in infrastructure: Port development, the Belt and Road Initiative and regional development. Journal of Transport Geography, 2020. 87: p. 102812.
- Tian, J., P. Wang, and D. Zhu, Overview of Chinese new energy vehicle industry and policy development. Green Energy and Resources, 2024. 2(2): p. 100075.
- Hao, X., et al., Toward Carbon Neutral Road Transport: Development Strategies and New R&D Organizational Paradigms. Automotive Innovation, 2024. 7(2): p. 209-224.
- Liu, X., et al., Do policy incentives drive electric vehicle adoption? Evidence from China. Transportation Research Part A: Policy and Practice, 2021. 150: p. 49-62.
- Xiao, G., et al., Which factors affect user satisfaction with ETC? Evidence from Shanghai and Beijing. Journal of Advanced Transportation, 2022. 2022(1): p. 3102249.
- Fu, Z., et al., Orderly solar charging of electric vehicles and its impact on charging behavior: A year-round field experiment. Applied Energy, 2025. 381: p. 125211.
- Chu, Y., et al., Assessment of Leading New Energy Vehicle City Markets in China and Policy Lessons. Электронный ресурс].—Режим доступа: https://theicct.org/wp-content/uploads/2022/09/China-EV-citymarkets_final. pdf, 2022. 1.
- Zhao, X., et al., Policy incentives and electric vehicle adoption in China: From a perspective of policy mixes. Transportation Research Part A: Policy and Practice, 2024. 190: p. 104235.
- Ma, J., et al., Electrification of Integrated Stereoscopic Transportation: A Perspective on the Electric Ride-Hailing, Transit, and Electric Vertical Takeoff and Landing Market in Jiangsu Province. World Electric Vehicle Journal, 2025. 16(3): p. 165.
- Linjuan, Z., et al., Site selection and capacity determination of charging stations considering the uncertainty of users’ dynamic charging demands. Frontiers in Energy Research, 2024. 11: p. 1295043.
- Shou, S. and Y. Li, Exploring the collaborative innovation operational model of government-industry-education synergy: a case study of BYD in China. Asian Journal of Technology Innovation, 2024: p. 1-36.
- Palmié, M., et al., Valuation entrepreneurship through product‐design and blame‐avoidance strategies: How Tesla managed to change the public perception of sustainable innovations. Journal of Product Innovation Management, 2024. 41(3): p. 644-676.
- Figenbaum, E. and M. Kolbenstvedt, Competitive electric town transport. Main results from COMPETT–an Electromobility+ project. TØI report, 2015. 1422: p. 2015.
- Hu, S., et al., The status quo and future trends of new energy vehicle power batteries in China — Analysis from policy perspective. Energy Reports, 2022. 8: p. 63-80.
- Zhang, Z., et al., Does digital global value chain participation reduce energy resilience? Evidence from 49 countries worldwide. Technological Forecasting and Social Change, 2024. 208: p. 123712.
- He, Z., et al., The impact of motivation, intention, and contextual factors on green purchasing behavior: New energy vehicles as an example. Business Strategy and the Environment, 2021. 30(2): p. 1249-1269.
- Laukkanen, M. and N. Tura, Sustainable value propositions and customer perceived value: Clothing library case. Journal of Cleaner Production, 2022. 378: p. 134321.
- Lin, W.L., The role of corporate social responsibility and corporate social irresponsibility in shaping corporate reputation: An analysis of competitive action and innovation strategies. Corporate Social Responsibility and Environmental Management, 2024. 31(2): p. 1451-1468.
- Shams, R., S. Chatterjee, and R. Chaudhuri, Developing brand identity and sales strategy in the digital era: Moderating role of consumer belief in brand. Journal of Business Research, 2024. 179: p. 114689.
- Kankam, G. and I.T. Charnor, Emotional intelligence and consumer decision-making styles: the mediating role of brand trust and brand loyalty. Future Business Journal, 2023. 9(1): p. 57.
- Saulītis, A., V. Silkāne, and G.A. Gaile, Nudging pro-environmental behaviour in a subsidized waste recycling system: A field experimental study. Journal of Environmental Psychology, 2024. 99: p. 102416.
- Abdul Qadir, S., et al., Navigating the complex realities of electric vehicle adoption: A comprehensive study of government strategies, policies, and incentives. Energy Strategy Reviews, 2024. 53: p. 101379.
- Lv, Z., et al., Impact of perceived value, positive emotion, product coolness and Mianzi on new energy vehicle purchase intention. Journal of Retailing and Consumer Services, 2024. 76: p. 103564.
- Zhao, H., et al., Consumers’ purchase intention toward electric vehicles from the perspective of perceived green value: An empirical survey from china. World Electric Vehicle Journal, 2024. 15(6): p. 267.
- Vo-Thanh, T., et al., The service digitalization in fine-dining restaurants: a cost-benefit perspective. International Journal of Contemporary Hospitality Management, 2022. 34(9): p. 3502-3524.
- Srivastava, A., et al., Impact of perceived value on the online purchase intention of base of the pyramid consumers. International Journal of Consumer Studies, 2023. 47(4): p. 1291-1314.
- Li, P. and Z. Zhang, The effects of new energy vehicle subsidies on air quality: Evidence from China. Energy Economics, 2023. 120: p. 106624.
- He, H., et al., China’s battery electric vehicles lead the world: achievements in technology system architecture and technological breakthroughs. Green Energy and Intelligent Transportation, 2022. 1(1): p. 100020.
- Hu, X., R.N.R. Yusof, and Z.D. Mansor, Consumers’ Purchase Intentions Towards New Energy Vehicles Based on the Theory of Planned Behaviour on Perceived Value: An Empirical Survey of China. World Electric Vehicle Journal, 2025. 16(3): p. 120.
- Zhao, X., et al., Assessment of the effects of China’s new energy vehicle industry policies: from the perspective of moderating effect of consumer characteristics. Environment, Development and Sustainability, 2025. 27(2): p. 4319-4340.
- Moon, S.-J., Effect of consumer environmental propensity and innovative propensity on intention to purchase electric vehicles: Applying an extended theory of planned behavior. International Journal of Sustainable Transportation, 2021. 16(11): p. 1032-1046.
- Yuan, J., et al., Sustainable development in brand loyalty: Exploring the dynamics of corporate social responsibility, customer attitudes, and emotional contagion. Corporate Social Responsibility and Environmental Management, 2024. 31(2): p. 1042-1051.
- Lin, B. and L. Shi, Do environmental quality and policy changes affect the evolution of consumers’ intentions to buy new energy vehicles. Applied Energy, 2022. 310: p. 118582.
- Wu, Z., et al., Public attitudes and sentiments towards new energy vehicles in China: A text mining approach. Renewable and Sustainable Energy Reviews, 2023. 178: p. 113242.
- Liang, T.-P., Y.-L. Lin, and H.-C. Hou, What drives consumers to adopt a sharing platform: An integrated model of value-based and transaction cost theories. Information & Management, 2021. 58(4): p. 103471.
- Bhutto, M.H., et al., Predicting consumer purchase intention toward hybrid vehicles: testing the moderating role of price sensitivity. European Business Review, 2022. 34(1): p. 62-84.
- Schlecht, I., C. Maurer, and L. Hirth, Financial contracts for differences: The problems with conventional CfDs in electricity markets and how forward contracts can help solve them. Energy Policy, 2024. 186: p. 113981.
- Zhang, C., et al., Customer-driven value creation in the digital economy: Determining the role of customer firms’ digital transformation on supplier performance in China. Omega, 2024. 128: p. 103132.
- Zhao, H., F. Furuoka, and R. Rasiah, The Influence of Psychological Factors on Consumer Purchase Intention for Electric Vehicles: Case Study from China: Integrating the Necessary Condition Analysis Methodology from the Perspective of Self-Determination Theory. World Electric Vehicle Journal, 2024. 15(8): p. 331.
- Cao, J., et al., Electric vehicle industry sustainable development with a stakeholder engagement system. Technology in Society, 2021. 67: p. 101771.
- Featherman, M., et al., The impact of new technologies on consumers beliefs: Reducing the perceived risks of electric vehicle adoption. Technological Forecasting and Social Change, 2021. 169: p. 120847.
- Fang, Z., et al., Estimating optimal substitution scale of urban gasoline taxis by electric taxis in the era of green energy: a case study of Zhengzhou City. Geo-spatial Information Science, 2023. 26(3): p. 514-539.
- Lv, Z., H. Lv, and M. Fridenfalk, Digital twins in the marine industry. Electronics, 2023. 12(9): p. 2025.
- Song, Y., et al., A decision support model for buying battery electric vehicles considering consumer learning and psychological behavior. Journal of Retailing and Consumer Services, 2023. 73: p. 103303.
- Pappas, A., et al., More than Machines: The Role of the Future Retail Salesperson in Enhancing the Customer Experience. Journal of Retailing, 2023. 99(4): p. 518-531.
- Zahoor, A., et al., A systematic study involving patent analysis and theoretical modeling of eco-friendly technologies for electric vehicles and power batteries to ease carbon emission from the transportation industry. Energy Conversion and Management, 2024. 321: p. 118996.
- Chen, C.-W., Utilizing a hybrid approach to identify the importance of factors that influence consumer decision-making behavior in purchasing sustainable products. Sustainability, 2024. 16(11): p. 4432.
- Lavuri, R., D. Roubaud, and O. Grebinevych, Sustainable consumption behaviour: Mediating role of pro-environment self-identity, attitude, and moderation role of environmental protection emotion. Journal of Environmental Management, 2023. 347: p. 119106.
- Marvi, R., D. Zha, and P. Foroudi, Elevating B2B branding in a global context: Integrating existing literature and proposing a forward-thinking conceptual framework. Industrial Marketing Management, 2024. 120: p. 247-272.
- Cheng, X., et al., How social interaction shapes habitual and occasional low-carbon consumption behaviors: Evidence from ten cities in China. Renewable and Sustainable Energy Reviews, 2023. 182: p. 113387.
- Parray, Z.A., J. Iqbal, and R. Mushtaq, Customer perception of corporate social responsibility and its impact on customer engagement: critical significance of corporate reputation. Corporate Communications: An International Journal, 2024. 29(4): p. 592-606.
- Le, T.T., Corporate social responsibility and SMEs’ performance: mediating role of corporate image, corporate reputation and customer loyalty. International Journal of Emerging Markets, 2023. 18(10): p. 4565-4590.
- Van Nguyen, M., K.D. Ha, and C.T. Phan, Sustainable development during economic uncertainty: What drives large construction firms to perform corporate social responsibility? Corporate Social Responsibility and Environmental Management, 2024. 31(4): p. 2838-2851.
- Malik, G. and D. Pradhan, How does gameful experience foster customer engagement and brand advocacy? Consumer insights into branding in e-tail. Journal of Consumer Marketing, 2025. 42(2): p. 205-222.
- Al‐Issa, N. and M. Thanasi, Mapping the Future of Tech‐Infused Luxury: A Roadmap and Research Directions. International Journal of Consumer Studies, 2024. 48(6): p. e13103.
- Yadav, M., R. Gupta, and K. Nair, Time for sustainable marketing to build a green conscience in consumers: Evidence from a hybrid review. Journal of Cleaner Production, 2024. 443: p. 141188.
- Gallarza, M.G., L. Maubisson, and A. Rivière, Replicating consumer value scales: A comparative study of EVS and PERVAL at a cultural heritage site. Journal of Business Research, 2021. 126: p. 614-623.
- Aaker, D.A., Measuring brand equity across products and markets. California management review, 1996. 38(3).
- Keller, K.L., Conceptualizing, Measuring, and Managing Customer-Based Brand Equity. Journal of Marketing, 1993. 57(1): p. 1-22.
- Taber, K.S., The Use of Cronbach’s Alpha When Developing and Reporting Research Instruments in Science Education. Research in Science Education, 2018. 48(6): p. 1273-1296.
- Joshi, Y., D.P. Uniyal, and D. Sangroya, Investigating consumers’ green purchase intention: Examining the role of economic value, emotional value and perceived marketplace influence. Journal of Cleaner Production, 2021. 328: p. 129638.
- Zhu, X., et al., Social and technological factors influencing consumer satisfaction with electric vehicles: An assimilation-contrast effect perspective. Research in Transportation Business & Management, 2024. 57: p. 101218.
- Zhu, J., et al., Using blockchain or not? A focal firm’s blockchain strategy in the context of carbon emission reduction technology innovation. Business Strategy and the Environment, 2024. 33(4): p. 3505-3531.
- Hasan, R., R. Shams, and M. Rahman, Consumer trust and perceived risk for voice-controlled artificial intelligence: The case of Siri. Journal of Business Research, 2021. 131: p. 591-597.
- Ahmad, E., et al., The influence of grid connectivity, electricity pricing, policy-driven power incentives, and carbon emissions on renewable energy adoption: Exploring key factors. Renewable Energy, 2024. 232: p. 121108.
- Liu, F. and G.R. Madni, Moderating role of policy incentive and perceived cost in relationship of environmental awareness and green consumption behavior. Plos one, 2024. 19(2): p. e0296632.
- Ng, P.M., et al., Green consumption and sustainable development: The effects of perceived values and motivation types on green purchase intention. Business Strategy and the Environment, 2024. 33(2): p. 1024-1039.
- Tran, N.K.H., Enhancing green brand equity through environmental reputation: The important of green brand image, green brand trust, and green brand loyalty. Business Strategy & Development, 2023. 6(4): p. 1006-1017.