Rattanakosin International College of Creative Entrepreneurship, Rajamangala University
of Technology Rattanakosin, Nakhon Pathom 73170, Thailand
Corresponding author Email: nutteera.pha@rmutr.ac.th
Article Publishing History
Received: 02/02/2025
Accepted After Revision: 18/03/2025
As China’s digital economy rapidly expands, understanding job satisfaction among IT professionals is increasingly critical. This study examines the influence of hygiene factors, motivator factors, and commute distance on job satisfaction in Chengdu’s IT sector, extending Herzberg’s Two-Factor Theory by incorporating commuting as an external variable. A quantitative approach was employed using a structured questionnaire. Data were collected from 520 IT employees via convenience sampling, and analyzed using Confirmatory Factor Analysis (CFA) and Structural Equation Modeling (SEM). The results indicate that both hygiene and motivator factors significantly enhance job satisfaction, while commute distance has a negative impact. These findings highlight the need for organizations and policymakers to address both internal workplace dynamics and external environmental stressors. The study contributes to theoretical development by integrating commuter-related variables into job satisfaction models and offers practical insights for HR strategies, urban planning, and sustainable workforce management in China’s high-tech industries.
digital economy; Two Factor Theory; IT employees; job satisfaction; sustainable workforce management.
Qin Z, Phakdeephirot N. Factors Influencing Job Satisfaction Among IT Industry Employees in Chengdu, China: Enhancing Herzberg’s Two-Factor Theory with Commute Distance. SSN Journal of Management & Technology Research Journal. 2025;2(1).
Qin Z, Phakdeephirot N. Factors Influencing Job Satisfaction Among IT Industry Employees in Chengdu, China: Enhancing Herzberg’s Two-Factor Theory with Commute Distance. SSN Journal of Management & Technology Research Journal. 2025;2(1). Available from: <a href=”https://surl.li/qphddy“>https://surl.li/qphddy</a>
INTRODUCTION
The Information Technology (IT) industry has emerged as a critical engine of global economic transformation, driving innovation across sectors through the adoption of advanced technologies such as artificial intelligence, cloud computing, big data analytics, and digital infrastructure. As the digital economy continues to reshape business operations and societal interactions, countries around the world, particularly China, have capitalized on this momentum to accelerate industrial upgrading and economic modernization [1, 2]. China has positioned itself as a global leader in digital innovation, leveraging its massive domestic market, technical talent, and strategic investments to become one of the world’s largest IT markets [1, 3].
Chengdu, a key city in western China, has rapidly developed into a regional IT hub. The city’s IT sector benefits from robust infrastructure, a deep talent pool supported by over 130 higher education institutions, and strong governmental support [4]. In 2024 alone, the sector employed more than 930,000 professionals and contributed over 671 billion RMB to Chengdu’s GDP, reflecting its central role in regional economic development [5, 6]. However, the fast-paced expansion of the IT industry has brought with it new workplace challenges, particularly in terms of employee wellbeing and job satisfaction [7].
The modern IT work environment is often characterized by long working hours, high cognitive demands, frequent technological changes, and intense performance pressure. These factors have been linked to rising levels of stress, burnout, and job dissatisfaction among IT professionals. Moreover, the increasing complexity of urban living, particularly long commuting times, adds another layer of stress for employees. In Chengdu, IT professionals spend an average of 70 minutes commuting daily—time that erodes work-life balance, reduces rest, and contributes to mental fatigue [8, 9].
Against this backdrop, employee wellbeing has emerged as a critical concern for both organizational leaders and policymakers. Studies have shown that higher levels of job satisfaction are associated with improved productivity, increased organizational commitment, and lower turnover rates [10, 11]. Addressing factors that influence job satisfaction—both internal (e.g., compensation, leadership, job design) and external (e.g., commute distance)—is essential to maintaining a healthy and sustainable IT workforce.
Herzberg’s Two Factor Theory offers a valuable theoretical lens through which to examine job satisfaction. According to the theory, job satisfaction is driven by two sets of factors: motivators (e.g., achievement, recognition, and career advancement) and hygiene factors (e.g., salary, company policy, supervision) [12]. Motivators contribute positively to job satisfaction when present, while the absence of hygiene factors may lead to dissatisfaction but not necessarily to satisfaction when improved [13-15]. This dichotomy has been widely validated across various sectors, including manufacturing, healthcare, and IT.
However, Herzberg’s model primarily focuses on workplace-centered factors and largely overlooks contextual or environmental variables, such as commuting. With urbanization on the rise and commute times lengthening, recent research has begun to emphasize the psychological and physical toll of commuting on employee wellbeing [16]. Commuting stress has been associated with increased fatigue, reduced productivity, and decreased job satisfaction, making it a salient yet underexplored determinant of workplace outcomes.
This study extends Herzberg’s Two-Factor Theory by incorporating commute distance as an exogenous variable affecting job satisfaction. By analyzing data from 520 IT professionals in Chengdu, this research explores how traditional motivators and hygiene factors, as well as commute related stressors, jointly influence job satisfaction in one of China’s fastest growing tech hubs. In doing so, the study addresses a critical gap in the literature and provides a more holistic framework for understanding job satisfaction in the modern digital workplace.
The significance of this research is twofold. Theoretically, it contributes to the evolving literature on workplace motivation by challenging the traditional boundary of Herzberg’s model and integrating nonwork place related factors into the analysis. Practically, it offers insights for human resource managers, policymakers, and urban planners seeking to improve job satisfaction and reduce turnover in the IT industry. As Chengdu continues to grow as a technology hub, understanding and addressing the full spectrum of factors affecting IT professionals’ wellbeing is imperative for ensuring long-term industry sustainability.
Literature Review: Herzberg’s Two-Factor Theory, also known as the motivation hygiene theory, provides one of the most enduring frameworks for understanding job satisfaction. The theory distinguishes between two categories of factors influencing employees’ attitudes toward work: motivators and hygiene factors. Motivators refer to intrinsic elements such as achievement, recognition, responsibility, and opportunities for advancement, which enhance satisfaction when present [12, 17, 18]. Hygiene factors, such as salary, supervision, organizational policies, and working conditions, do not inherently improve satisfaction but can cause dissatisfaction if absent or inadequate [13]. This dual structure has been validated across sectors including healthcare, education, and technology, reinforcing its relevance in analyzing workplace well being in complex organizational environments.
While Herzberg’s theory has remained a foundational framework, modern workplace dynamics necessitate theoretical refinements. Contemporary research has expanded the application of the Two-Factor Theory to account for external contextual variables that were not originally considered. For instance, He, Fu [19] integrated the theory with performance pressure to examine how excessive workload could undermine motivation. Similarly, in digital and remote working environments, factors such as technology access, schedule flexibility, and employee autonomy now play a role in shaping satisfaction [20]. These adaptations underscore the evolving nature of work and highlight the need to include both internal organizational factors and external environmental variables in modern job satisfaction models, particularly in fast-changing industries such as IT.
The IT industry presents unique challenges to employee satisfaction. Due to rapid innovation cycles, constant upskilling demands, and high project complexity, IT professionals often experience stress, burnout, and job instability. In this context, hygiene factors such as competitive salary, efficient supervision, and favorable working conditions are essential for mitigating dissatisfaction. Poor organizational support or rigid company policies can exacerbate turnover intentions, even among highly capable employees (Conroy & Morton, 2024) [21-23].
Conversely, motivator factors are crucial for long-term engagement in the IT workforce. Opportunities for advancement, recognition for innovation, intellectual challenge, and autonomy are vital for sustaining satisfaction [24]. Companies that offer mentorship programs, performance-based rewards, and meaningful work environments experience greater retention and commitment from their workforce [25]. Therefore, understanding how hygiene and motivator factors operate in tandem is essential for building an adaptive and competitive IT workforce, particularly in high-growth technology cities like Chengdu.
Despite the robustness of Herzberg’s framework, it largely omits variables outside the organizational setting, particularly those associated with employee lifestyle and urban infrastructure. Commute distance—defined as the physical or temporal gap between an employee’s home and workplace—has emerged as a significant determinant of job satisfaction, especially in urbanized regions [26, 27]. Research increasingly shows that longer commute times contribute to stress, fatigue, decreased productivity, and lower satisfaction [28, 29]. These effects are exacerbated when employees must navigate inefficient public transit or high traffic congestion, common in expanding metropolitan areas like Chengdu.
The inclusion of commute distance as a hygienic-like external factor thus provides a more comprehensive model of job satisfaction. It acknowledges that daily stressors beyond the workplace can impact employees’ perceptions of work-life balance, energy levels, and psychological well-being—thereby influencing job satisfaction even when internal organizational factors are well-managed.
Building on the extended conceptual framework, this study proposes an integrative model that positions commute distance alongside Herzberg’s original motivator and hygiene factors. The goal is to analyze how these variables collectively shape job satisfaction among IT professionals in Chengdu.
Based on this theoretical development, the following hypotheses are proposed:
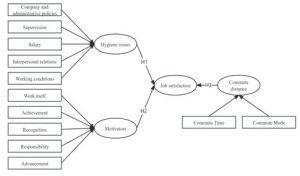
H1: Hygiene factors (e.g., salary, company policies, supervision) have a significant positive impact on job satisfaction.
H2: Motivator factors (e.g., achievement, recognition, advancement) significantly enhance job satisfaction.
H3: Commute distance has a significant negative impact on job satisfaction, acting as an external contextual stressor.
This extended framework not only strengthens the explanatory power of Herzberg’s model but also reflects the complex realities of urban labor markets, particularly within China’s rapidly expanding digital economy. Figure 1 shows the empirical model.
Figure 1: Theoretical Framework
METHODOLOGY
Sampling Strategy and Data Collection: This study adopts a quantitative research design to investigate the factors influencing job satisfaction among IT professionals in Chengdu, China. The target population comprises employees working in various IT-related positions, including software development, cloud computing, data analysis, AI engineering, and IT support services. A convenience sampling method was employed to ensure accessibility and coverage of diverse employee profiles across the city’s major IT zones. The survey was distributed through both online platforms (e.g., WeChat, Xiaohongshu) and physical channels (e.g., posters with QR codes in tech parks), allowing for participation from individuals working in multinational corporations, local enterprises, and startups.
A total of 520 valid responses were collected, aligning with the recommended rule of thumb for sample size estimation—10 times the number of items in the measurement instrument ([30]. This sample size is deemed statistically sufficient for conducting confirmatory factor analysis (CFA) and structural equation modeling (SEM). All participants had at least six months of experience in their current IT roles, ensuring familiarity with company policies, job responsibilities, and commuting experiences.
Measurement Instruments: The questionnaire design was grounded in established literature and adapted to the local context of Chengdu’s IT industry. All constructs were measured using 5point Likert scales (1 = strongly disagree to 5 = strongly agree). The scale items were derived from validated instruments in previous studies and refined through a pilot test.
Hygiene Factors (25 items): Adapted from Adamopoulos and Syrou [31] and Ghimire, Dahal [32], the hygiene construct includes five dimensions—company policy, supervision, salary, interpersonal relationships, and working conditions. Items reflect employees’ perceptions of policy fairness, managerial competence, compensation adequacy, team collaboration, and workplace infrastructure.
Motivator Factors (18 items): Based on Wang, Gan [33] and Herzberg’s original theoretical components, this construct includes work meaning, achievement, recognition, responsibility, and advancement. Items assess employees’ sense of purpose, career development opportunities, and professional recognition within Chengdu’s tech sector.
Commute Distance (4 items): Derived from Emre and and De Spiegeleare [34], this external factor includes commute time and mode of transportation. The items assess how commuting affects work-life balance, productivity, and stress.
Job Satisfaction (3 items): Adapted from Wong [35], this construct measures overall satisfaction, career alignment, and engagement within the IT profession. Items reflect employee contentment with job roles, compensation, and future growth opportunities.
Each item was refined through a pilot study (n = 52) to ensure clarity, relevance, and internal consistency. Cronbach’s alpha values exceeded 0.85 for all variables, indicating high reliability.
Data Analysis Procedures: To analyze the collected data, the study employed a multistep statistical approach. First, descriptive statistics were used to summarize respondent demographics and variable distributions. Second, reliability analysis using Cronbach’s alpha was conducted to test internal consistency. Third, Confirmatory Factor Analysis (CFA) was applied to evaluate the construct validity of the measurement model, ensuring acceptable model fit indicators (e.g., CFI, RMSEA, TLI).
Following validation, Structural Equation Modeling (SEM) was used to test the hypothesized relationships between hygiene factors, motivators, commute distance, and job satisfaction. SEM is particularly suitable for this study due to its ability to handle latent variables and simultaneously estimate multiple dependency relationships. Additionally, KaiserMeyerOlkin (KMO) and Bartlett’s test of sphericity were conducted to verify the data’s suitability for factor analysis. All statistical analyses were performed using SPSS and AMOS software, ensuring robust and replicable results.
RESULTS
Descriptive Analysis: Table 1 shows several key characteristics of IT professionals in Chengdu. Gender distribution indicates a significant male majority, with 69.8% male and 30.2% female, reflecting the traditionally maledominated nature of the IT industry. In terms of age, the largest proportion of participants falls within the 2939 age group (37.7%), followed closely by the 1828 age group (36.9%), suggesting that Chengdu’s IT workforce is primarily composed of young and midcareer professionals. The 40 and above group (25.4%) is relatively smaller, indicating fewer senior professionals, possibly due to the dynamic and rapidly evolving nature of the industry, which may favor younger, more adaptable employees.
Regarding educational qualifications, 39.2% of participants hold a master’s degree, making it the most common qualification, followed by 36.2% with a bachelor’s degree and 24.6% with a Ph.D. This suggests that a significant portion of IT professionals in Chengdu have advanced education, reflecting the industry’s demand for specialized skills and expertise. The annual income distribution further aligns with this, with the majority of participants earning ¥100,000 ¥300,000 (43.5%), followed by 40.8% earning below ¥100,000, and only 15.7% earning above ¥300,000. This indicates that while a substantial portion of the workforce earns moderate salaries, highincome roles are relatively limited, possibly restricted to senior positions or niche technical expertise. These findings provide insights into the demographic, educational, and economic structure of Chengdu’s IT workforce, forming a solid foundation for further analysis of job satisfaction factors.
Table 1. Sample Information
| Information and options | Frequency | Percent | |
| Gender | Male | 363 | 69.8 |
| Female | 157 | 30.2 | |
| Age | 1828 | 192 | 36.9 |
| 2939 | 196 | 37.7 | |
| 40 and above | 132 | 25.4 | |
| Education Level | Bachelor’s | 188 | 36.2 |
| Master’s | 204 | 39.2 | |
| Ph.D. | 128 | 24.6 | |
| Annual Income | Below 100,000 | 212 | 40.8 |
| 100,000 300,000 | 226 | 43.5 | |
| Above 300,000 | 82 | 15.7 | |
Table 2 provides the descriptive statistics for the study variables, presenting key measures such as mean, standard deviation (S.D.), skewness, and kurtosis for each of the items under the “Hygiene issues” and “Motivators” categories. The mean scores for most items fall between 3.50 and 3.62, suggesting that the respondents generally perceive the statements as moderately favorable. This indicates a relatively consistent response pattern across the variables, with participants’ perceptions aligned towards a neutraltopositive outlook regarding both hygiene and motivational factors in their work environment. The standard deviations range from 0.974 to 1.076, reflecting moderate variability in responses. The relatively high standard deviations suggest some diversity in individual perceptions, which is not unexpected in the context of subjective variables such as job satisfaction and motivators.
The skewness values for all items are negative, indicating that the distribution of responses is slightly skewed to the left, with more respondents rating the items towards the higher end of the scale. The skewness values, ranging from 0.597 to 0.877, suggest that the data is moderately skewed, but not excessively so, indicating a generally balanced distribution of responses. Similarly, the kurtosis values are close to zero, ranging from 0.615 to 0.039, suggesting that the distribution of responses is approximately normal, without significant outliers. These results indicate that the items under both “Hygiene issues” and “Motivators” exhibit reasonable normality in their distribution, supporting the suitability of the data for further statistical analysis [36].
Table 2. Descriptive Statistics Results
| Study variables | Items | Mean | S.D. | Skewness | Kurtosis | ||
| Value | S.E. | Value | S.E. | ||||
| Hygiene issues | HI1 | 3.560 | 1.024 | 0.736 | 0.107 | 0.266 | 0.214 |
| HI2 | 3.610 | 1.013 | 0.778 | 0.107 | 0.125 | 0.214 | |
| HI3 | 3.600 | 1.030 | 0.765 | 0.107 | 0.247 | 0.214 | |
| HI4 | 3.520 | 1.022 | 0.684 | 0.107 | 0.429 | 0.214 | |
| HI5 | 3.510 | 1.076 | 0.763 | 0.107 | 0.285 | 0.214 | |
| HI6 | 3.540 | 1.010 | 0.641 | 0.107 | 0.407 | 0.214 | |
| HI7 | 3.590 | 1.045 | 0.726 | 0.107 | 0.293 | 0.214 | |
| HI8 | 3.580 | 1.032 | 0.577 | 0.107 | 0.615 | 0.214 | |
| HI9 | 3.560 | 1.019 | 0.680 | 0.107 | 0.318 | 0.214 | |
| HI10 | 3.560 | 1.030 | 0.597 | 0.107 | 0.563 | 0.214 | |
| HI11 | 3.610 | 1.024 | 0.699 | 0.107 | 0.399 | 0.214 | |
| HI12 | 3.550 | 1.027 | 0.764 | 0.107 | 0.267 | 0.214 | |
| HI13 | 3.530 | 1.029 | 0.739 | 0.107 | 0.373 | 0.214 | |
| HI14 | 3.580 | 1.038 | 0.773 | 0.107 | 0.224 | 0.214 | |
| HI15 | 3.520 | 0.974 | 0.665 | 0.107 | 0.405 | 0.214 | |
| HI16 | 3.610 | 1.010 | 0.730 | 0.107 | 0.170 | 0.214 | |
| HI17 | 3.590 | 1.018 | 0.688 | 0.107 | 0.318 | 0.214 | |
| HI18 | 3.590 | 1.045 | 0.721 | 0.107 | 0.289 | 0.214 | |
| HI19 | 3.570 | 1.037 | 0.729 | 0.107 | 0.288 | 0.214 | |
| HI20 | 3.620 | 1.021 | 0.774 | 0.107 | 0.098 | 0.214 | |
| HI21 | 3.560 | 1.043 | 0.877 | 0.107 | 0.039 | 0.214 | |
| HI22 | 3.610 | 1.016 | 0.816 | 0.107 | 0.131 | 0.214 | |
| HI23 | 3.580 | 0.979 | 0.651 | 0.107 | 0.455 | 0.214 | |
| HI24 | 3.620 | 1.019 | 0.733 | 0.107 | 0.331 | 0.214 | |
| HI25 | 3.590 | 1.050 | 0.758 | 0.107 | 0.191 | 0.214 | |
| Motivators | MO1 | 3.580 | 0.988 | 0.660 | 0.107 | 0.393 | 0.214 |
| MO2 | 3.560 | 0.974 | 0.772 | 0.107 | 0.227 | 0.214 | |
| MO3 | 3.560 | 1.037 | 0.697 | 0.107 | 0.429 | 0.214 | |
| MO4 | 3.540 | 1.072 | 0.781 | 0.107 | 0.213 | 0.214 | |
| MO5 | 3.600 | 1.036 | 0.682 | 0.107 | 0.355 | 0.214 | |
| MO6 | 3.580 | 1.021 | 0.745 | 0.107 | 0.210 | 0.214 | |
| MO7 | 3.570 | 1.048 | 0.796 | 0.107 | 0.219 | 0.214 | |
| MO8 | 3.590 | 0.999 | 0.746 | 0.107 | 0.236 | 0.214 | |
| MO9 | 3.590 | 1.020 | 0.635 | 0.107 | 0.521 | 0.214 | |
| MO10 | 3.540 | 1.025 | 0.551 | 0.107 | 0.660 | 0.214 | |
| MO11 | 3.580 | 1.013 | 0.736 | 0.107 | 0.303 | 0.214 | |
| MO12 | 3.540 | 1.027 | 0.775 | 0.107 | 0.287 | 0.214 | |
| MO13 | 3.570 | 1.055 | 0.793 | 0.107 | 0.251 | 0.214 | |
| MO14 | 3.550 | 1.033 | 0.647 | 0.107 | 0.460 | 0.214 | |
| MO15 | 3.570 | 1.014 | 0.713 | 0.107 | 0.341 | 0.214 | |
| MO16 | 3.560 | 1.034 | 0.703 | 0.107 | 0.305 | 0.214 | |
| MO17 | 3.610 | 1.015 | 0.747 | 0.107 | 0.194 | 0.214 | |
| MO18 | 3.530 | 1.001 | 0.822 | 0.107 | 0.254 | 0.214 | |
| Commute distance | CD1 | 3.650 | 1.026 | 0.640 | 0.107 | 0.408 | 0.214 |
| CD2 | 3.550 | 0.986 | 0.752 | 0.107 | 0.281 | 0.214 | |
| CD3 | 3.560 | 1.011 | 0.670 | 0.107 | 0.484 | 0.214 | |
| CD4 | 3.590 | 1.024 | 0.701 | 0.107 | 0.348 | 0.214 | |
| Job satisfaction | JS1 | 3.570 | 0.971 | 0.747 | 0.107 | 0.182 | 0.214 |
| JS2 | 3.620 | 1.025 | 0.697 | 0.107 | 0.300 | 0.214 | |
| JS3 | 3.580 | 0.965 | 0.646 | 0.107 | 0.497 | 0.214 | |
Reliability test: Table 3 presents the reliability statistics for the study variables, using Cronbach’s α to assess the internal consistency of the measurement scales. Cronbach’s α is a widely used statistic that quantifies the degree to which multiple items within a scale are interrelated and consistently measure the same underlying construct. A value above 0.7 is typically considered acceptable, indicating that the scale demonstrates sufficient reliability for further analysis. In the case of this study, the Cronbach’s α values for all variables exceed the threshold of 0.7, confirming the internal consistency of the scales used [37].
Specifically, the “Hygiene issues” scale, with a Cronbach’s α of 0.969, and the “Motivators” scale, with a value of 0.957, exhibit excellent reliability, suggesting a strong interrelationship among the items within these constructs. Additionally, the Cronbach’s α values for “Commute distance” (0.846) and “Job satisfaction” (0.798) are also above the acceptable threshold, further supporting the reliability of these scales. Although these values are slightly lower than those for “Hygiene issues” and “Motivators,” they still indicate a high level of consistency among the items measuring these constructs. Taken together, the results presented in Table 4.5 provide strong evidence of the reliability of the measurement instruments, ensuring that the data collected is robust and suitable for subsequent analysis.
Table 3. Reliability Statistics
| Study variables | Number of questions | Cronbach‘s α |
| Hygiene issues | 25 | 0.969 |
| Motivators | 18 | 0.957 |
| Commute distance | 4 | 0.846 |
| Job satisfaction | 3 | 0.798 |
Validity test: Table 4 presents the results of the KaiserMeyerOlkin (KMO) Measure of Sampling Adequacy and Bartlett’s Test of Sphericity, both of which are crucial for assessing the suitability of the data for factor analysis. The KMO statistic, with a value of 0.978, indicates an excellent level of sampling adequacy. KMO values above 0.7 are generally deemed acceptable, and values closer to 1.0 reflect stronger correlations among the variables, thereby supporting the validity of the factor analysis. A KMO value of 0.978 suggests that the data is highly suitable for factor analysis, with variables being sufficiently intercorrelated to uncover meaningful latent structures. Bartlett’s Test of Sphericity further confirms the appropriateness of the data for factor analysis. The test yields a ChiSquare value of 17,458.787 with 1,225 degrees of freedom and a pvalue of 0.000. The highly significant result (p < 0.001) rejects the null hypothesis that the correlation matrix is an identity matrix, indicating that there are significant correlations among the variables [37]. This provides strong evidence that the data can be factorized and that factor analysis will yield meaningful results.
Table 4. KMO and Bartlett’s Test
| Kaiser-Meyer Olkin Measure of Sampling Adequacy. | .978 | |
|
Bartlett’s Test of Sphericity |
Approx. Chi-Square | 17458.787 |
| df | 1225 | |
| Sig. | .000 | |
Structural Equation Model: Figure 2 illustrates the measurement model for the study, displaying the relationships between the latent variables, observed variables, and error terms. The ovals represent the latent variables, which are unobservable constructs measured by multiple indicators (the squares). In this diagram, the latent variables include “Hygiene issues,” “Motivators,” “Commute distance,” and “Job satisfaction,” each of which is associated with a set of observed variables that serve as indicators of these constructs. The error terms, represented by small circles, capture the variance in the observed variables that is not explained by the latent variables. The arrows connecting the observed variables to their corresponding latent variables indicate the directional relationships, illustrating how each indicator is linked to the underlying construct. The measurement model also demonstrates the correlations among the latent variables, which are represented by the bidirectional arrows between them, highlighting their interdependencies and the degree to which they share common variance.
Figure 2: Measurement model
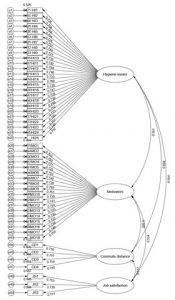
Table 5 presents the fit indices for the measurement model, providing critical information on how well the proposed model fits the data. The first fit index, χ²/df (Chisquare divided by degrees of freedom), yields a value of 1.294, which is well below the threshold of 3, indicating a good fit between the model and the data. A χ²/df ratio under 3 suggests that the model is not overfitting and that the observed data adequately support the hypothesized structure. The RMSEA (Root Mean Square Error of Approximation) value of 0.024 is also below the recommended cutoff of 0.08, signifying a good fit and suggesting minimal approximation error.
A lower RMSEA indicates that the model provides a close fit to the population covariance matrix, thereby supporting the model’s validity. Additional fit indices include the GFI (Goodness of Fit Index) and AGFI (Adjusted Goodness of Fit Index), with values of 0.899 and 0.890, respectively. Both of these values exceed the benchmark of 0.85, reflecting a good fit. The NFI (Normed Fit Index), TLI (Tucker-Lewis Index), and CFI (Comparative Fit Index) all exceed the threshold of 0.85, with values of 0.916, 0.979, and 0.980, respectively, further confirming the model’s strong fit [38]. These indices collectively indicate that the model is an adequate representation of the data, demonstrating that the measurement model adequately reflects the relationships between the latent and observed variables.
Table 5. Measure model fit index
| Fit index | χ2/df | RMSEA | GFI | AGFI | NFI | TLI | CFI |
| Reference standards | <3 | <0.08 | >0.85 | >0.85 | >0.85 | >0.85 | >0.85 |
| Result | 1.294 | 0.024 | 0.899 | 0.890 | 0.916 | 0.979 | 0.980 |
Table 6 presents the results of the convergent validity analysis for the study’s latent variables. Convergent validity is assessed using two key metrics: the Composite Reliability (CR) and the Average Variance Extracted (AVE). CR reflects the internal consistency of the indicators that measure a particular latent variable, while AVE assesses the extent to which the indicators explain the variance in the latent variable. According to the guidelines for confirmatory factor analysis, convergence validity is considered satisfactory if the CR value is greater than 0.7 and the AVE value exceeds 0.50. In this table, the CR values for all latent variables, including “Hygiene issues” (0.969), “Motivators” (0.957), “Commute distance” (0.847), and “Job satisfaction” (0.798), all surpass the 0.7 threshold, demonstrating excellent internal consistency. Similarly, the AVE values for all variables—ranging from 0.555 for “Hygiene issues” to 0.580 for “Commute distance”—are above the recommended minimum of 0.50, indicating that the latent variables account for a substantial portion of the variance in their respective indicators.
The factor loadings for the observed indicators range from 0.703 to 0.791 across the latent variables, with the majority of loadings exceeding the commonly accepted threshold of 0.7. These high factor loadings suggest that each observed indicator contributes significantly to its respective latent variable, further supporting the validity of the measurement model. For instance, the factor loadings for “Hygiene issues” range from 0.716 (for HI9) to 0.785 (for HI22), and for “Motivators,” they range from 0.703 (for MO1) to 0.791 (for MO12). These results collectively affirm the robustness of the measurement model and validate the constructs being measured [37].
Table 6. Convergence Validity
| Latent variables | Observation indicators | Factor loading | CR | AVE |
| Hygiene issues | HI1 | 0.725 | 0.969 | 0.558 |
| HI2 | 0.758 | |||
| HI3 | 0.754 | |||
| HI4 | 0.754 | |||
| HI5 | 0.725 | |||
| HI6 | 0.732 | |||
| HI7 | 0.744 | |||
| HI8 | 0.721 | |||
| HI9 | 0.716 | |||
| HI10 | 0.730 | |||
| HI11 | 0.784 | |||
| HI12 | 0.746 | |||
| HI13 | 0.733 | |||
| HI14 | 0.769 | |||
| HI15 | 0.720 | |||
| HI16 | 0.747 | |||
| HI17 | 0.728 | |||
| HI18 | 0.739 | |||
| HI19 | 0.768 | |||
| HI20 | 0.752 | |||
| HI21 | 0.773 | |||
| HI22 | 0.785 | |||
| HI23 | 0.757 | |||
| HI24 | 0.746 | |||
| HI25 | 0.752 | |||
| Motivators | MO1 | 0.703 | 0.957 | 0.555 |
| MO2 | 0.759 | |||
| MO3 | 0.771 | |||
| MO4 | 0.728 | |||
| MO5 | 0.753 | |||
| MO6 | 0.749 | |||
| MO7 | 0.739 | |||
| MO8 | 0.765 | |||
| MO9 | 0.761 | |||
| MO10 | 0.730 | |||
| MO11 | 0.741 | |||
| MO12 | 0.791 | |||
| MO13 | 0.725 | |||
| MO14 | 0.730 | |||
| MO15 | 0.722 | |||
| MO16 | 0.736 | |||
| MO17 | 0.746 | |||
| MO18 | 0.755 | |||
| Commute distance | CD1 | 0.716 | 0.847 | 0.580 |
| CD2 | 0.791 | |||
| CD3 | 0.754 | |||
| CD4 | 0.783 | |||
| Job satisfaction | JS1 | 0.753 | 0.798 | 0.569 |
| JS2 | 0.738 | |||
| JS3 | 0.771 |
Table 7 presents the results of the discriminant validity test, which is used to assess whether the latent variables in the study are distinct from one another. Discriminant validity ensures that a variable is not highly correlated with other variables in the model, thereby confirming that each latent construct represents a unique dimension of the theoretical framework. In this table, the diagonal values represent the square root of the Average Variance Extracted (AVE) for each latent variable, which serves as an indicator of the variable’s ability to explain the variance of its indicators. For example, the diagonal value of 0.747 for “Hygiene issues” reflects the square root of its AVE, indicating a solid proportion of the variance explained by this construct. The corresponding off-diagonal values represent the correlations between the latent variables, with all correlations falling below the threshold of 0.85, which is typically considered an indication of acceptable discriminant validity.
The results from Table 4.9 suggest that each latent variable maintains sufficient distinctiveness from the others. For instance, the correlation between “Hygiene issues” and “Motivators” is 0.551, which is lower than the square root of their respective AVEs (0.747 and 0.745), indicating that the two constructs are sufficiently different from one another. Similarly, the correlations between “Commute distance” and the other latent variables, such as “Hygiene issues” (0.604) and “Motivators” (0.582), remain below the threshold of 0.85, supporting the idea that these constructs represent separate dimensions. The “Job satisfaction” variable shows similar patterns, with correlations of 0.554, 0.534, and 0.517 with the other latent variables, which further reinforces the discriminant validity of the measurement model [39].
Table 7. Discriminant validity test
| Latent variables | Hygiene issues | Motivators | Commute distance | Job satisfaction |
| Hygiene issues | 0.747 | |||
| Motivators | 0.551 | 0.745 | ||
| Commute distance | 0.604 | 0.582 | 0.762 | |
| Job satisfaction | 0.554 | 0.534 | 0.517 | 0.754 |
| Note: The diagonal is the square root of the corresponding variable’s AVE. | ||||
Figure 3 illustrates the structural model in the context of the study, depicting the relationships among latent variables, observed variables, error terms, and path coefficients. The latent variables—”Hygiene issues,” “Motivators,” “Job satisfaction,” and “Commute distance”—are represented by ovals, while the observed variables, or indicators, are shown as squares, with their corresponding factor loadings indicated on the arrows. The arrows connecting the latent variables signify the hypothesized directional relationships, where “Hygiene issues” and “Motivators” both influence “Job satisfaction,” with path coefficients of 0.567 and 0.400, respectively. Similarly, “Job satisfaction” affects “Commute distance,” as indicated by the path coefficient of 0.184. The error terms, represented by small circles, account for the unexplained variance in the observed variables. The path coefficients provide insight into the strength and direction of the relationships between the variables, highlighting the structural dependencies in the model. This diagram effectively captures the theoretical framework, illustrating both the direct and indirect effects among the study’s constructs and providing a clear representation of the model’s structure.
Figure 3: Structural model
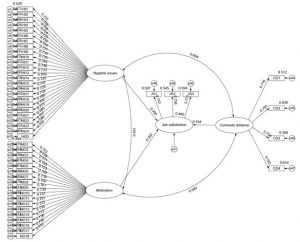
Table 8 presents the model fit indices for the structural model, providing an assessment of how well the proposed model aligns with the observed data. The χ²/df (Chi-square divided by degrees of freedom) ratio is 1.294, which is below the threshold of 3, indicating a good fit between the structural model and the data. This ratio suggests that the model does not suffer from overfitting, and the data support the hypothesized relationships. The RMSEA (Root Mean Square Error of Approximation) value of 0.024 is well below the recommended cutoff of 0.08, indicating that the model approximates the true population covariance matrix with minimal error, further supporting the model’s goodness of fit. Additionally, the Goodness of Fit Index (GFI) and the Adjusted Goodness of Fit Index (AGFI) are both above the 0.85 threshold, with values of 0.899 and 0.890, respectively, suggesting that the model explains a substantial proportion of the variance in the data. The Normed Fit Index (NFI), Tucker-Lewis Index (TLI), and Comparative Fit Index (CFI) all exceed the 0.85 threshold, with values of 0.916, 0.979, and 0.980, respectively [38]. These indices indicate a very strong fit, demonstrating that the structural model is an appropriate representation of the data.
Table 8. Model fit index
| Fit index | χ2/df | RMSEA | GFI | AGFI | NFI | TLI | CFI |
| Reference standards | <3 | <0.08 | >0.85 | >0.85 | >0.85 | >0.85 | >0.85 |
| Result | 1.294 | 0.024 | 0.899 | 0.890 | 0.916 | 0.979 | 0.980 |
Table 9 presents the results of the direct path effects, offering a detailed analysis of the relationships between the study’s latent variables. Each hypothesis tests the direct impact of one variable on another, with path coefficients (unstandardized estimates) representing the strength of these relationships. The unstandardized estimates provide the raw effect sizes, showing the magnitude of change in the dependent variable (Job satisfaction, JS) for a unit change in the independent variables (Hygiene issues, HI; Motivators, MO; Commute distance, CD). For instance, the path from Hygiene issues (HI) to Job satisfaction (JS) has an unstandardized estimate of 0.294, meaning that for each one-unit increase in Hygiene issues, Job satisfaction increases by 0.294 units. Similarly, the paths from Motivators (MO) to Job satisfaction (JS) and from Commute distance (CD) to Job satisfaction (JS) have unstandardized estimates of 0.276 and 0.183, respectively.
The table 9 also includes the standardized path coefficients (β), which provide a normalized measure of the strength of the relationships between the variables.
H1: Hygiene Issues (HI) → Job Satisfaction (JS)
Path coefficient (β = 0.298, p < 0.001)
Hypothesis H1 is supported, indicating that hygiene issues (HI) exert a significant positive effect on job satisfaction (JS).
Hygiene factors encompass company and administrative policies, supervision, salary, interpersonal relations, and working conditions.
According to Herzberg’s TwoFactor Theory, these factors are classified as hygiene factors, which do not necessarily enhance job satisfaction but can prevent dissatisfaction when adequately addressed.
The path coefficient of 0.294 suggests that improvements in hygiene factors lead to a significant increase in job satisfaction, reinforcing the notion that maintaining a well-structured work environment and fair compensation policies contribute to employees’ overall job contentment.
H2: Motivators (MO) → Job Satisfaction (JS)
Path coefficient (β = 0.262, p < 0.001)
Hypothesis H2 is supported, demonstrating that motivators (MO) have a significant positive influence on job satisfaction (JS).
Motivators include the nature of the work itself, achievement, responsibility, advancement, and recognition.
In Herzberg’s framework, these elements represent intrinsic motivators that drive employees’ engagement and foster long-term job satisfaction.
The path coefficient of 0.276 indicates that an increase in intrinsic motivators—such as opportunities for professional growth, meaningful work, and recognition—leads to a higher level of job satisfaction, supporting the argument that organizations should cultivate an environment that promotes personal and professional development.
H3: Commute Distance (CD) → Job Satisfaction (JS)
Path coefficient (β = 0.184, p = 0.005)
Hypothesis H3 is supported, revealing that commute distance (CD) has a significant negative effect on job satisfaction (JS).
Commute distance is conceptualized through commute time and commute mode.
Prior research suggests that long commuting times and inconvenient commuting modes may contribute to increased stress and work-life imbalance, potentially reducing job satisfaction.
The path coefficient of 0.183, while lower than those of HI and MO, remains statistically significant (p = 0.005), suggesting that longer and more challenging commutes are associated with lower job satisfaction. This finding underscores the importance of considering employees’ commuting conditions when designing workplace policies, such as flexible working arrangements or strategic office locations.
Overall Interpretation
Hygiene factors (H1) and motivators (H2) exert a stronger influence on job satisfaction, aligning with Herzberg’s theory that hygiene factors mitigate dissatisfaction while motivators enhance satisfaction.
Commute distance (H3) demonstrates a weaker yet significant effect, implying that longer commutes can adversely impact employees’ job satisfaction.
From a managerial perspective, organizations seeking to enhance job satisfaction should not only improve extrinsic work conditions (e.g., salary, policies, supervision) but also focus on intrinsic factors (e.g., career growth, recognition, meaningful work). Additionally, organizations should consider implementing policies that minimize employees’ commuting burdens to sustain higher levels of job satisfaction.
Table 9. Direct path effects
DISCUSSION
Discussion of Findings
This study aimed to examine the factors influencing job satisfaction among IT professionals in Chengdu by extending Herzberg’s Two-Factor Theory with an additional external factor—commute distance. The results of the structural equation modeling (SEM) confirm the theoretical assumptions and provide important empirical insights.
Firstly, the analysis supports Hypothesis 1, revealing that hygiene factors have a significant positive impact on job satisfaction. Consistent with Herzberg’s original framework, employees’ satisfaction is strongly influenced by tangible aspects such as salary competitiveness, clear company policies, and favorable working conditions. This finding echoes prior studies indicating that inadequate hygiene conditions can lead to dissatisfaction, particularly in high-intensity sectors like IT [32, 40].
Secondly, motivator factors are shown to exert a substantial and statistically significant influence on job satisfaction, confirming Hypothesis 2. Factors such as recognition, achievement, professional growth, and meaningful work were highly valued among Chengdu’s IT professionals. This aligns with the intrinsic motivation literature, which posits that intellectual challenge, autonomy, and advancement opportunities are especially critical in knowledge-based industries [41].
Thirdly, and most notably, the results validate Hypothesis 3, demonstrating that commute distance negatively affects job satisfaction. Employees with longer commutes reported lower levels of satisfaction, primarily due to diminished work-life balance and increased stress. This supports recent findings on the psychological and physical burden of commuting [34, 42] and underscores the need to consider commuter-related variables as part of a holistic job satisfaction model.
Collectively, these findings suggest that traditional workplace interventions—while necessary—are insufficient on their own. External contextual factors like commuting must also be addressed to foster sustainable employee wellbeing.
Theoretical Contributions: This research makes a meaningful theoretical contribution by extending Herzberg’s Two-Factor Theory beyond the organizational boundary. By incorporating commute distance as an external factor, the study challenges the traditional binary classification of motivators and hygiene factors and proposes a more integrative model that better reflects modern urban work environments.
Furthermore, by applying this extended framework to the context of Chengdu’s IT industry, the study offers a contextualized understanding of job satisfaction in high-growth, knowledge-intensive economies. This localization helps bridge the gap between global organizational theories and China’s unique urban and industrial dynamics.
Practical Implications: From a practical standpoint, the study offers actionable insights for HR managers, urban planners, and policymakers:
- For IT firms: Investing in both hygiene and motivator systems—such as flexible working hours, clear promotion mechanisms, and supervisor training—can directly enhance job satisfaction and reduce turnover rates.
- On commute management: Employers should explore hybrid work models, shuttle services, or office relocation strategies to minimize commuting burdens.
- For policymakers: Urban development strategies should integrate housing affordability near tech zones, improve public transit accessibility, and support smart city innovations that reduce commuting pressure for tech workers.
In sum, improving employee satisfaction in the IT sector requires not only internal organizational adjustments but also systemic solutions addressing the urban ecosystem in which professionals operate.
Limitations and Future Research: Despite its contributions, this study is subject to several limitations. First, the use of convenience sampling may limit the generalizability of the results to the broader IT population in China or other countries. Second, the study adopts a cross-sectional design, preventing causal inferences. Future research should consider longitudinal methods to track changes in job satisfaction over time and explore additional external variables such as housing affordability or remote work readiness.
Moreover, qualitative studies could complement this quantitative model by exploring the subjective experiences behind commuting stress or motivator perceptions in depth.
CONCLUSION
In conclusion, this study provides a nuanced understanding of job satisfaction among IT professionals in Chengdu by integrating Herzberg’s Two-Factor Theory with commute distance as a contextual variable. The findings affirm the importance of both internal organizational factors and external living conditions in shaping employee wellbeing. As China’s digital economy continues to evolve, attention to the comprehensive work-life experience of IT employees will be essential for building.
REFERENCES
- Shi, Y. and F. Wei, Comparative Analysis of Digital Economy-Driven Innovation Development in China: An International Perspective. Journal of the Knowledge Economy, 2024: p. 1-43.
- Li, W., W. Cui, and P. Yi, Digital economy evaluation, regional differences and spatio-temporal evolution: Case study of Yangtze River economic belt in China. Sustainable Cities and Society, 2024. 113: p. 105685.
- Liu, G., et al., Understanding mechanisms of digital transformation in state-owned enterprises in China: An institutional perspective. Technological Forecasting and Social Change, 2024. 202: p. 123288.
- Li, X., Z. Chen, and Y. Chen, The Impact of Digital Talent Inflow on the Co-Agglomeration of the Digital Economy Industry and Manufacturing. Systems, 2024. 12(8): p. 317.
- Wu, Z., et al., Regional differences and dynamic evolution of high-quality development in service industry: A case study of the Chengdu-Chongqing economic circle. Plos one, 2024. 19(3): p. e0297755.
- Wan, J., et al., A spatial econometric investigation into road traffic accessibility and economic growth: insights from the Chengdu-Chongqing twin-city economic circle. Humanities and Social Sciences Communications, 2024. 11(1): p. 183.
- Sandhu, S., et al., Enhancing Job Satisfaction in a Tech-Driven Workplace. Sustainable Management Practices for Employee Retention and Recruitment, 2025: p. 151.
- Pooladvand, S. and S. Hasanzadeh, Neurophysiological evaluation of workers’ decision dynamics under time pressure and increased mental demand. Automation in Construction, 2022. 141: p. 104437.
- Singh, P., et al., Enforced remote working: The impact of digital platform-induced stress and remote working experience on technology exhaustion and subjective wellbeing. Journal of Business Research, 2022. 151: p. 269-286.
- Uslu Sahan, F. and F. Terzioglu, Transformational leadership practices of nurse managers: the effects on the organizational commitment and job satisfaction of staff nurses. Leadership in Health Services, 2022. 35(4): p. 494-505.
- Hashmi, M.A., A. Al Ghaithi, and K. Sartawi, Impact of flexible work arrangements on employees’ perceived productivity, organisational commitment and perceived work quality: a United Arab Emirates case-study. Competitiveness Review: An International Business Journal, 2023. 33(2): p. 332-363.
- Thant, Z.M., Assessing the determinants of Myanmar government employees’ job satisfaction through Herzberg’s two-factor theory. Chinese Public Administration Review, 2023. 14(1): p. 27-38.
- Pratama, R.A., et al., Effect of Extrinsic Job Satisfaction Hygiene Factors and Intrinsic Job Satisfaction Motivation on Turnover Intention. Bulletin of Counseling and Psychotherapy, 2023. 5(2): p. 148-158.
- Kures, M. and S.C. Deller, Growth in commuting patterns and their impacts on rural workforce and economic development. Economic Development Quarterly, 2023. 37(1): p. 54-63.
- Glazener, A., et al., Fourteen pathways between urban transportation and health: A conceptual model and literature review. Journal of Transport & Health, 2021. 21: p. 101070.
- Conceição, M.A., et al., The effect of transport infrastructure, congestion and reliability on mental wellbeing: a systematic review of empirical studies. Transport reviews, 2023. 43(2): p. 264-302.
- Ewen, R.B., P.C. Smith, and C.L. Hulin, An empirical test of the herzberg two-factor theory. Journal of applied psychology, 1966. 50(6): p. 544.
- Van den Broeck, A., et al., Beyond intrinsic and extrinsic motivation: A meta-analysis on self-determination theory’s multidimensional conceptualization of work motivation. Organizational Psychology Review, 2021. 11(3): p. 240-273.
- He, Q., et al., “Thriving at work” or not? Research on the effects of performance pressure based on achievement motivation theory and two-factor theory. Journal of Managerial Psychology, 2024. 39(2): p. 146-161.
- Seeber, I. and J. Erhardt, Working from Home with Flexible and Permeable Boundaries. Business & Information Systems Engineering, 2023. 65(3): p. 277-292.
- Leka, S. and A. Jain, Conceptualising work-related psychosocial risks: Current state of the art and implications for research, policy and practice. Policy And Practice, 2024: p. 254.
- Sepiriti, S., Analysis of the Contributing Factors to Teachers’ Job Dissatisfaction in Lesotho Secondary Schools and the Mitigating Strategies. European Journal of Educational Management, 2024. 7(4): p. 185-198.
- Li, L., et al., Examining sustainable hospitality practices and employee turnover in Pakistan: The interplay of robotics awareness, mutual trust, and technical skills development in the age of artificial intelligence. Journal of Environmental Management, 2025. 373: p. 123922.
- Ghobakhloo, M., et al., Industry 4.0, innovation, and sustainable development: A systematic review and a roadmap to sustainable innovation. Business Strategy and the Environment, 2021. 30(8): p. 4237-4257.
- Subramaniam, S.H., et al., Key factors influencing long-term retention among Contact Centre employee in Malaysia: a Delphi method study. Cogent Business & Management, 2024. 11(1): p. 2370444.
- Shen, Y., N. Ta, and Z. Liu, Job-housing distance, neighborhood environment, and mental health in suburban Shanghai: A gender difference perspective. Cities, 2021. 115: p. 103214.
- Chen, L., M. Chen, and C. Fan, Age disparities and socioeconomic factors for commuting distance in Beijing by explainable machine learning. Cities, 2024. 155: p. 105493.
- Kapitza, J., Commuting at night: How time of day affects commuter perceptions. Travel Behaviour and Society, 2024. 35: p. 100750.
- Ma, L., et al., Impact of commuting time on self-reported work productivity: A quasi-longitudinal examination. Travel Behaviour and Society, 2024. 37: p. 100837.
- Ogbanufe, O. and L. Ge, A comparative evaluation of behavioral security motives: Protection, intrinsic, and identity motivations. Computers & Security, 2023. 128: p. 103136.
- Adamopoulos, I.P. and N.F. Syrou, Associations and correlations of job stress, job satisfaction and burn out in public health sector. European Journal of Environment and Public Health, 2022. 6(2): p. em0113.
- Ghimire, B., et al., Motivators and Hygiene Factors Affecting Academics in Nepalese Higher Education Institutions: Applying Herzberg’s Two-Factor Theory. Journal of Business and Social Sciences Research, 2024. 9(2): p. 1-16.
- Wang, Q., et al., Public service motivation and public employees’ turnover intention: the role of job satisfaction and career growth opportunity. Personnel Review, 2024. 53(1): p. 99-118.
- Emre, O. and S. and De Spiegeleare, The role of work–life balance and autonomy in the relationship between commuting, employee commitment and well-being. The International Journal of Human Resource Management, 2021. 32(11): p. 2443-2467.
- Wong, F.M.F., Job satisfaction in nursing: A qualitative inquiry into novice and experienced nurses’ perspectives. Nurse Education in Practice, 2024. 78: p. 104018.
- Wang, Y., C. Liu, and Y.-F. Tu, Factors affecting the adoption of AI-based applications in higher education. Educational Technology & Society, 2021. 24(3): p. 116-129.
- Azarmehr, T., et al., Psychometric Properties of the Persian Version of the Principal Instructional Leadership Scale for High School Principals (PILS): Translation, Psychometric Properties, and Network Analysis. The Asia-Pacific Education Researcher, 2024: p. 1-12.
- Zhang, M., et al., Multidimensional factors affecting care needs in daily living among community-dwelling older adults: A structural equation modelling approach. 2021. 29(5): p. 1207-1219.
- Alshammari, M.M., Y.H. Al-Mamary, and A.A. Abubakar, Revolutionizing education: unleashing the power of social media in Saudi Arabian public universities. Humanities and Social Sciences Communications, 2024. 11(1): p. 808.
- Conroy, S.A. and J.W. Morton, The Role of Human Resource Management in Surviving or Thriving: A Review of Compensation Systems and Low-Wage Work. Research in Personnel and Human Resources Management, 2024: p. 1-44.
- Ajmal, M., Z. Sareet, and A. Islam, Unleashing innovation through employee voice behavior in the hotel industry: the impact of ambidextrous leadership on innovative work behavior. Journal of Hospitality and Tourism Insights, 2025. 8(2): p. 448-471.
- Gerpott, F.H., W. Rivkin, and D. Unger, Autonomous or controlled self-regulation, that is the question: A self-determination perspective on the impact of commuting on employees’ domain-specific functioning. Organizational Psychology Review, 2022. 13(1): p. 67-95.